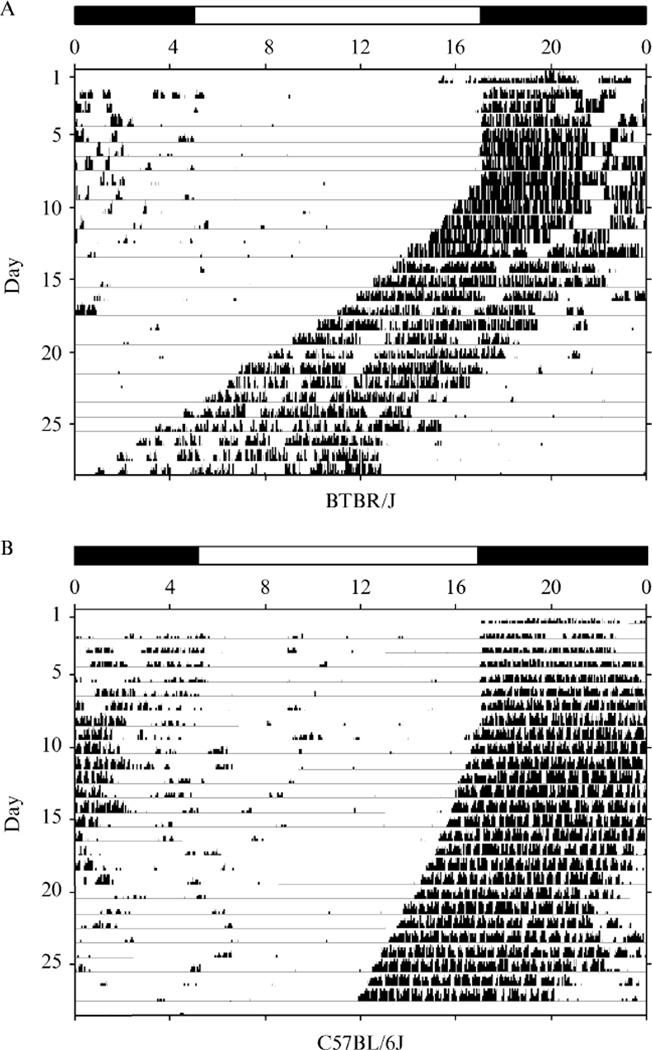
Figure 1.
Mouse actograms. (A) BTBR/J mouse. (B) C57BL/6J mouse. The light cycle for the LD portion of the experiment is represented by a bar at the top of the actogram where lights are on at 5:00 h and off at 17:00 h. Activity bouts are represented as histogram bars (the sum of wheel revolutions per discrete time interval) across a 24-h period. Each horizontal line represents one 24-h period of the experiment. Mice were maintained on a LD cycle for the first 7 days of the experiment and DD for the last 21 days. The difference in free running periods between these two mice is solely due to background strain differences.

