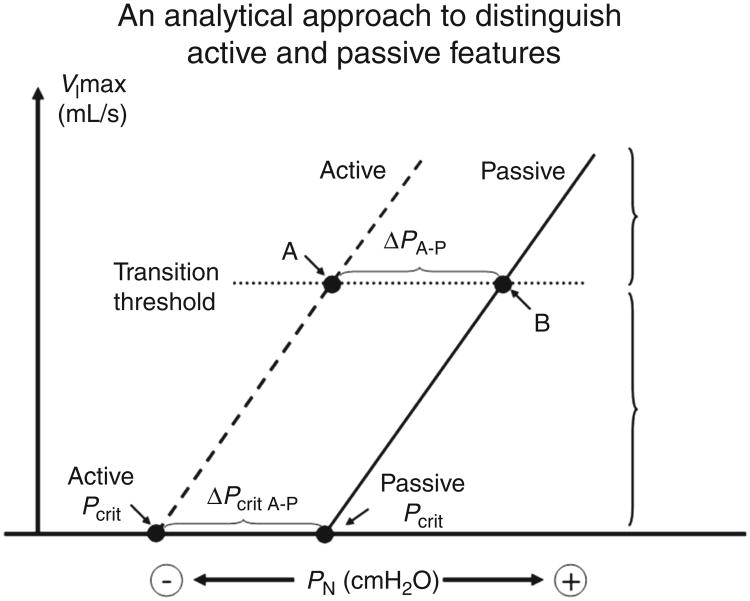
Figure 5.
Illustrations of the determination of Pcrit. (extrapolation, flow/pressure plots). The pressure-flow plots including data from flowlimited breaths that occur following drops in mask pressure (Pn is nasal pressure, analogous to Pao, which is airway opening pressure). V̇max is the maximum flow occurring during flow-limited breathing. The active curve is acquired from data gathered during gradual progressive drops in Pn whereas the passive curve is from breaths following brief drops in Pn from a holding pressure. The passive curve is said to reflect the passive mechanics of the airway, whereas the active curve includes neuromuscular compensation and other factors. (Adapted, with permission, from Patil et al. [94])

