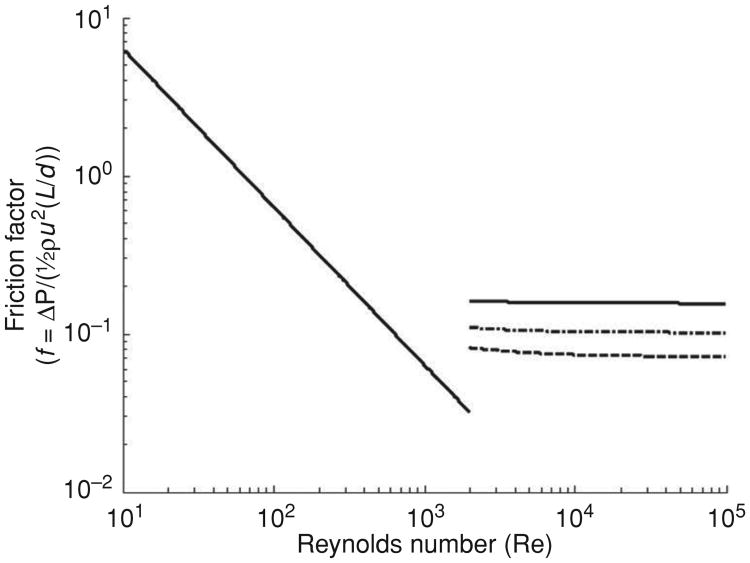
Figure 9.
A Moody diagram showing the relationship between friction factor f , defined as the ratio of the pressure drop (ΔP) to the Bernoulli term (½ρu2) and scaled by the length to diameter ratio (L /d). Here, ρ is gas density and u is characteristic velocity. The Reynolds number is given by Re = ρud/μ, where μ is gas viscosity. Both f and Re are dimensionless. Two characteristic regimes are displayed. For low Re, flow is laminar, pressure drops are linearly proportional to flow and gas viscosity. Beyond a transition region of Re ≈ 1000 to 2000, the flow becomes turbulent, and pressure drops become quadratic in flow, and proportional to gas density. The three curves above the transition correspond to different roughnesses of the airway, defined as the ratio of the magnitude of radial undulations in the lumen to the airway diameter. The dotted, dot-dash, and dashed curves are for roughnesses of 0.05, 0.1, and 0.2, respectively. The detailed behavior in the transition region is difficult to define with any accuracy, as it is associated with fine details of airway geometry.

