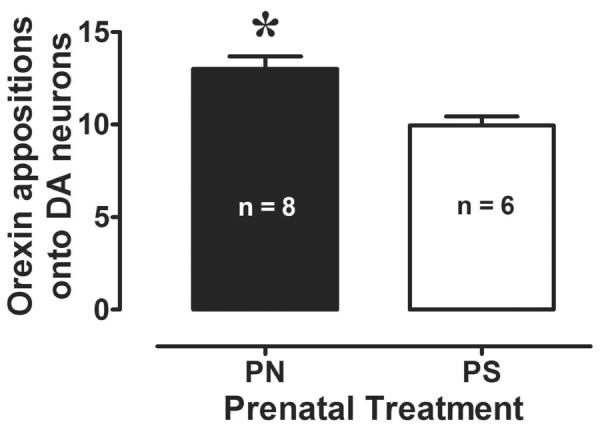
Figure 2.

Mean (±SEM) total orexin-positive appositions on VTA DA neurons for the PS and PN groups. Numbers represent the average summed total (appositions/neuron) for each animal based on total appositions counted on twenty randomly-selected TH-positive neurons. The PN group exhibited an increased number of orexin and TH appositions in the VTA relative to the PS group. * indicates a significant difference between PS and PN animals, p<0.05.
