Fig. 4.
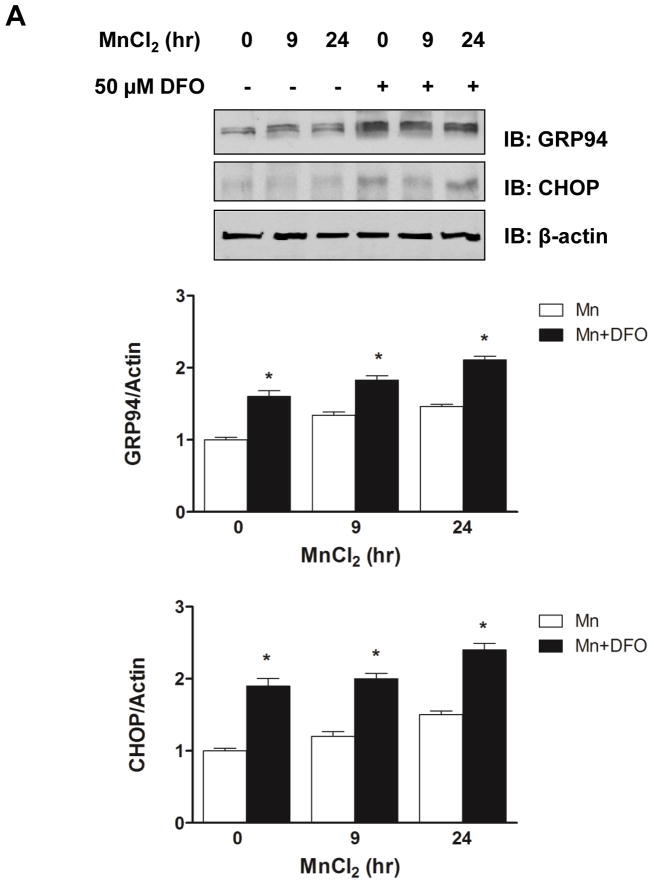
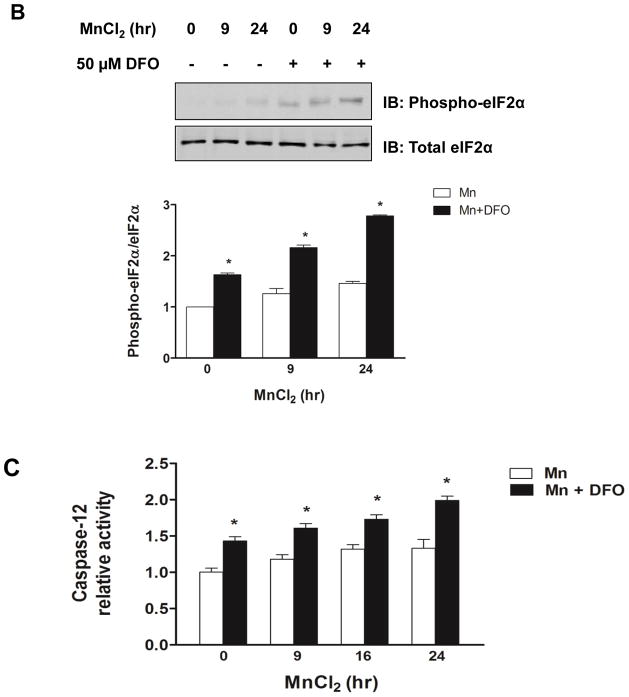
Iron depletion enhanced Mn-induced ER stress genes and activation of caspase-12. (A) Representative immunoblot of GRP94 and CHOP in SH-SY5Y cells treated with (+) or without (−) DFO before treatment of MnCl2 for 9 h or 24 h. Total cell lysates were separated by SDS-PAGE, and membranes were immunoblotted with GRP94 or CHOP antibody. Band intensity of GRP94 or CHOP was normalized to actin and expressed as relative intensity of untreated cells. Data represent mean ± SEM from three independent experiments. * P < 0.05 vs. Mn treatment group; two-way ANOVA. (B) Representative immunoblot of phosphorylated eIF2α (Phospho-eIF2α) in SH-SY5Y cells treated with (+) or without (−) DFO before treatment of MnCl2 for 9 h or 24 h. Total eIF2α was used as a loading control. Band intensity of P-eIF2α was normalized to eIF2α and expressed as relative intensity of untreated cells. Data represent mean ± SEM from three independent experiments. * P < 0.05 vs. Mn treatment group. (C) The caspase-12 activity in the cell lysates was determined using the fluorometric specific substrate ATAD-AFC. Fluorescence was measured in a 96-well black plate at excitation 400 nm and emission 505 nm using a microplate reader. Empty and closed bars represent MnCl2-treated cells without and with DFO, respectively. Data represent mean ± SEM of relative activity observed in untreated cells (n=3 samples/treatment). * P < 0.05 vs. Mn treatment group; two-way ANOVA.


