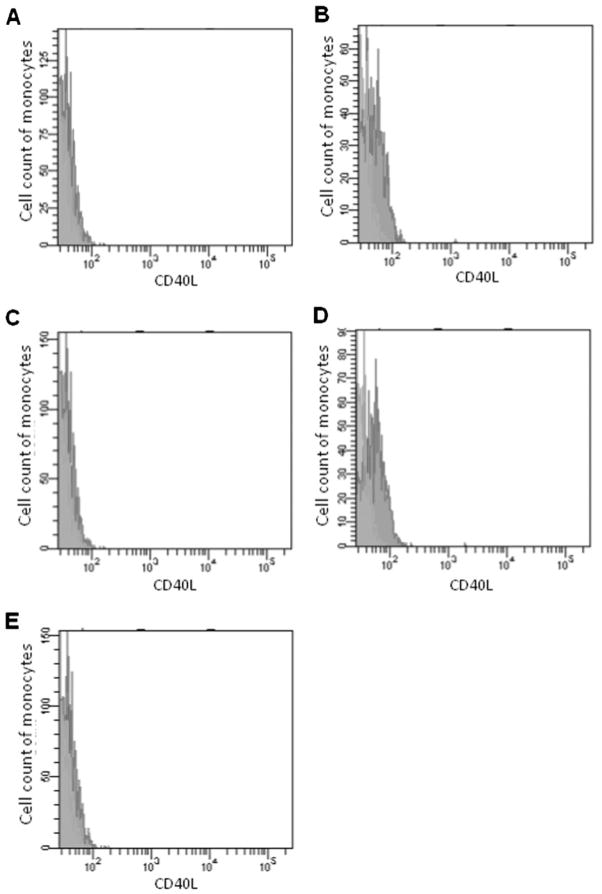
Figure 1.
Detection of CD40L-expressing peripheral blood monocytes by flow cytometry. Monocytes gated by flow cytometry and expression of CD40L were assessed by the mean fluorescence intensity. Green area represents isotype control and red area represents CD40L detection. The x-axis represents CD40L fluorescence intensity and the y-axis represents the number of blood monocytes. (A) Normal control. (B) Carotid artery stenosis only. (C) Small-artery occlusion infarct. (D) Large-artery atherosclerotic infarct. (E) Cardioaortic cerebral embolism infarct.

