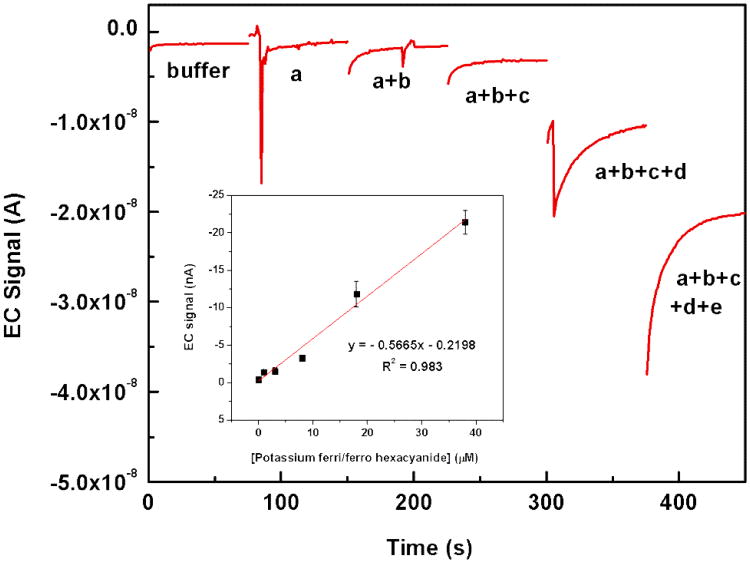
Fig. 3.
Cumulative amperometric response example of ferri/ferro hexacynaide in 0.1 M PB, pH 7.0 for five channels. The analyte solution was injected consecutively into the different channels. First, only channel a, then channel a+b, then channels a+b+c etc. contained the redox marker. The concentrations injected in channel a, b, c, d, and e was 1, 2, 5, 10, and 20 μM respectively. All measurements were carried out at 400 mV (stagnant condition). Inset: dose response curve from triplicate measurements.

