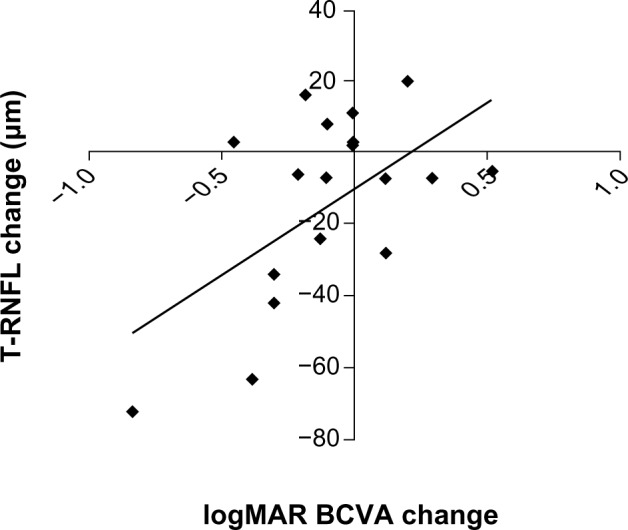
Figure 4.

Scatter plot showing the change in T-RNFL thickness in eyes with epiretinal membrane from baseline on the y-axis versus change in vision in logMAR units from baseline on the x-axis (r = 0.56; P = 0.007). The diagonal line represents the best-fitted linear regression
Abbreviations: T-RNFL, temporal peripapillary retinal nerve fiber layer; BCVA, best-corrected visual acuity; logMAR, logarithm of the minimal angle of resolution.
