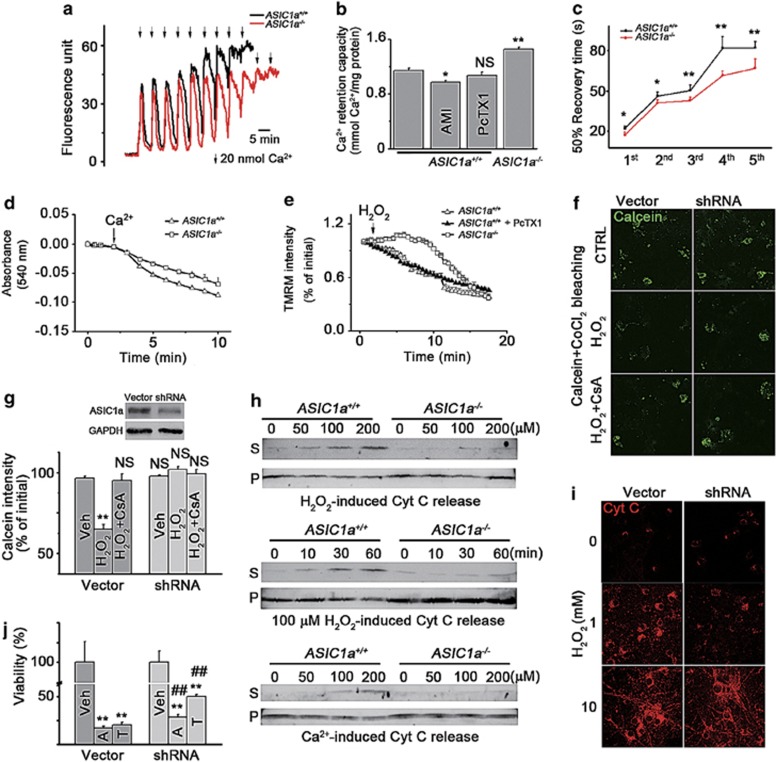
Figure 2.
MPT is impaired in mitochondria of ASIC1a−/−neurons. (a) Representative traces of Ca2+ uptake by isolated mitochondria from ASIC1a+/+ (black trace) and ASIC1a−/− brains (red trace). (b) Ca2+ retention capacity of indicated groups (n=16 for ASIC1a+/+ control, n=11 for ASIC1a−/−, n=4 for ASIC1a+/+ AMI and PcTX1 groups; *P<0.05, **P<0.01, NS, no statistical significance, by unpaired t-test). (c) Fifty per cent recovery time of extramitochondrial Ca2+ (first five peaks in panel a were calculated, n=8–11, *P<0.05, **P<0.01, by unpaired t-test). (d) Time courses of Ca2+-induced swelling of isolated brain mitochondria from ASIC1a+/+ (triangles) and ASIC1a−/− (squares) mice. Data are means±S.E.M. of four experiments. (e) Time courses of ΔΨm loss induced by 100 μM H2O2 in cultured cortical neurons from ASIC1a+/+ (open triangles) and ASIC1a−/− (open squares) mice. In ASIC1a+/+ neurons, 200 nM PcTX1 (filled triangles) failed to affect the ΔΨm loss. Data are means±S.E.M. of four experiments. (f and g) Representative images of calcein-CoCl2 bleaching assays (f) and the summary data for relative calcein intensities in cells treated with H2O2 (1 mM) or H2O2+CsA (10 μM) for 1 h (g); n=3 for each group. Inset shows shRNA-knockdown efficiency as determined by western blot. **P<0.01, NS, no statistical significance, by unpaired t-test. (h) Cyt C release induced by H2O2 (upper and middle panels) and Ca2+ (bottom panel) from brain mitochondria isolated from ASIC1a+/+ and ASIC1a−/− mice. Mitochondria were incubated with different concentrations of H2O2 (upper panel) or Ca2+ (lower panel) for 60 min or with 100 μM H2O2 for different time periods (middle panel) as indicated (S, supernatant; P, pellet). (i) H2O2-induced Cyt C release in whole neurons. (j) shRNA of ASIC1a significantly reduced neuronal death caused by 5 μM thapsigargin (T) or 1 μM A23187 (A) (n=4 for each group, **P<0.01, compared with Veh, ##P<0.01, compared between the groups treated with the same drugs, by unpaired t-test; data are means±S.E.M. for all bar graphs)

