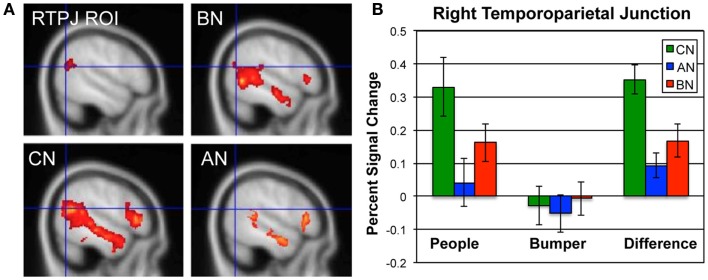
Figure 1.
Neural activations in the RTPJ during the social attribution task. (A) The RTPJ ROI is shown in the upper left, and the group maps for the People–Bumper contrast are all shown at sagittal coordinate x = 52 for the BN (upper right panel), CN (lower left panel), and AN (lower right panel) groups. (B) The percent signal change in the RTPJ ROI for the People condition, Bumper condition, and the difference in modulation for each group (green, CN; blue, AN; red, BN).

