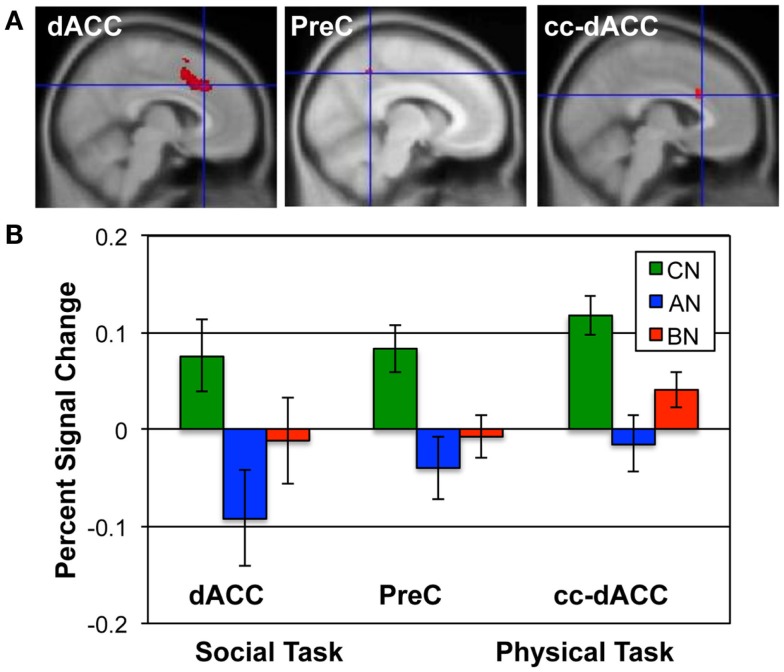
Figure 2.
ROIs and the percent signal change in each group for the Social and Physical Identity contrasts. (A) The upper row shows the extent of each ROI in red; from left to right, the dACC (MNI x = 6; Social Identity Reflected–Self); the precuneus (x = −8; Social Identity Self–Friend); and the cc-dACC (x = −6; Physical Identity Self–Friend). (B) The bar graphs shows the average percent signal modulation within each ROI for the CN (green), AN (blue), and BN (red) groups. Percent signal change was computed for the contrast and task that defined each ROI; the Social Identity task for both the dACC and PreC; the Physical Identity task for the cc-dACC.

