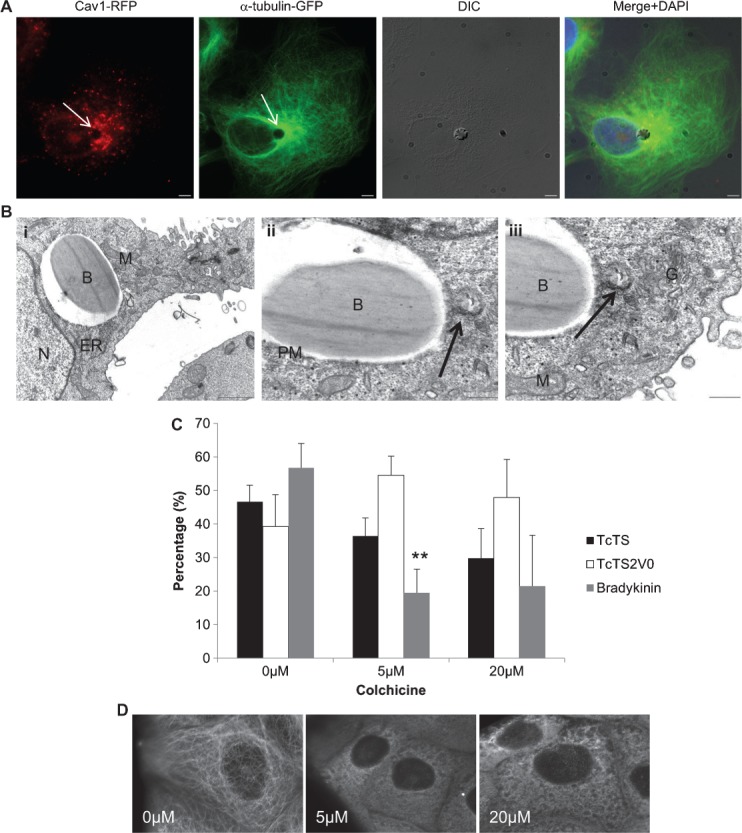
Figure 3. Microtubule dynamics in perinuclear positioning of internalized microparticles.

Beads coated with TcTS (DIC) were incubated with MDCK II cells stably expressing GFP-tubulin (green) and cav1-RFP (red) for 6 h. The arrows indicate the position of the bead, scale bar = 5 µm (A). MDCK II cells were incubated overnight with TcTS coated beads before preparation for transmission electron microscopy (B). The 4 µm white beads are shown here in close proximity to mitochondria (m), golgi (G) and ER, scale bar = 1 µm (i). The centrosome (arrow) is also visible in very close proximity to the bead, scale bar = 0.5 µm (ii). Close to the centriole the golgi is clearly visible, scale bar = 0.5 µm (iii). B-bead, PM-phagosomal membrane and N-nucleus. MDCK II cells were incubated with 0, 2, 20 μm of colchicine to depolymerize microtubules before incubating with TcTS, TcTS2V0 and bradykinin coated beads for 3 h. The number of internalized TcTS coated beads was determined by biotinylation (mean ± SEM, N = 3, **p = 0.008) (C). MDCK II cells expressing GFP-tubulin were imaged after application of the indicated concentrations of colchicine (D).
