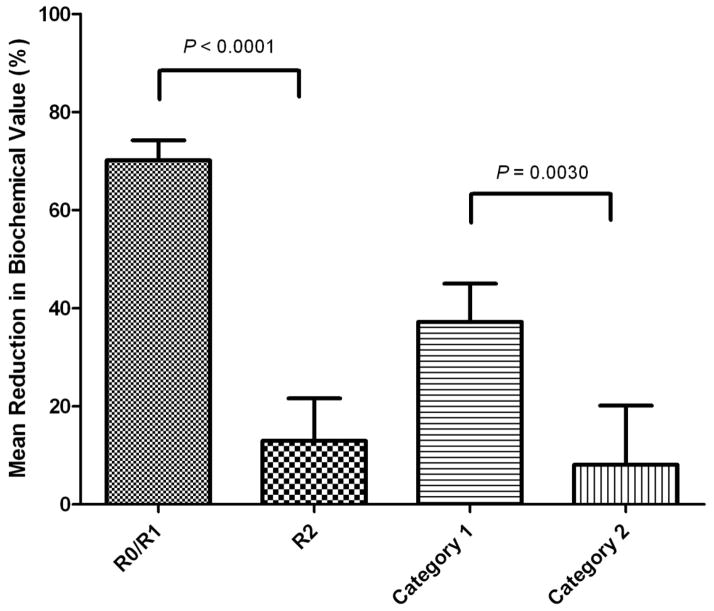
Figure 4.
Mean Laboratory Reduction Achieved by Surgery. R0/R1 mean 70.1% reduction (range, 99.3% reduction to 4% increase); R2 mean 12.9% reduction (range, 99.1% reduction to 236% increase). Category 1 mean 37.2% reduction (range, 99.3% reduction to 236.1% increase); Category 2 mean 8.1% reduction (range 79.2% reduction to 183.5% increase).

