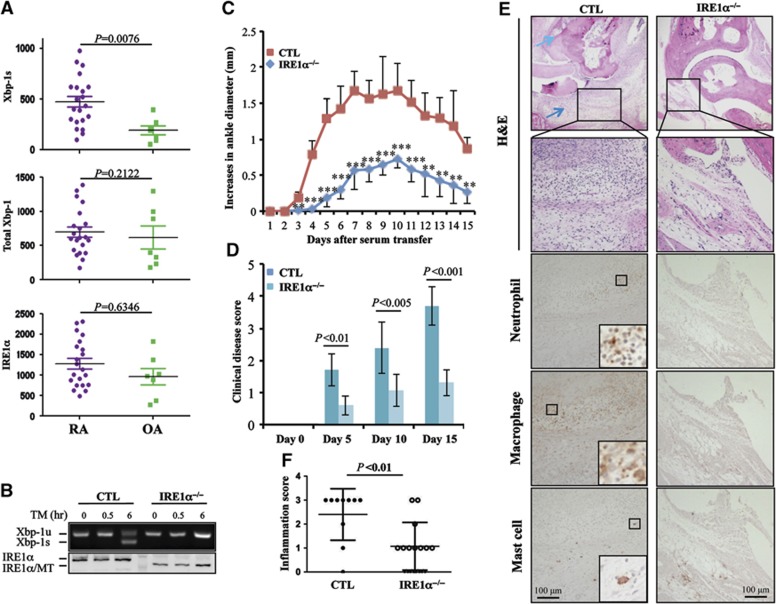
Figure 1.
IRE1α activation promotes inflammatory arthritis in humans and mice. (A) Analysis of IRE1α activation in macrophages from patients with RA. Synovial fluids from patients with RA (N=21) or OA (N=7) were cultured in 6-well plates for 2 h. Total RNA from the adherent cells was extracted. The levels of spliced XBP-1 (XBP-1s), total XBP-1, and IRE1α mRNA were determined by quantitative real-time RT–PCR using β-actin as an internal control. Student’s t-test was used for the statistical analysis, and P-values are indicated. (B) Bone marrow-derived macrophages from control and IRE1α conditional knockout mice were stimulated with TM (5 g/ml) for different time intervals. The expression levels of IRE1α protein were determined by western blotting (bottom panel). The mRNA levels of unspliced XBP-1 and spliced XBP-1 were determined by semi-quantitative RT–PCR. (C–F) Control (CTL, N=5) and IRE1αflox/floxLysM-Cre+ (IRE1α−/−, N=8) mice were treated with serum from K/BxN mice by intraperitoneal injection (200 μl/mouse). The diameter of the ankle joints was measured daily. (C) The increases in the ankle joint diameters in millimeters and (D) the disease scores (described in Materials and methods) are shown. (E, F) Mice were euthanized at day 15 after anti-GPI treatment, tissue sections of the ankle joints were analysed by H&E staining, and the representative images are shown (top two panels). The light blue arrow indicates cartilage erosion and dark blue arrow shows the immune cell infiltration. The infiltration of neutrophils (third panel), macrophages (fourth panel), and mast cells (bottom panel) was characterized by IHC staining as described in Materials and methods (E). The inflammation of joint sections was scored (F). Student’s t-test was used for the statistical analysis. **P<0.01, ***P<0.005; error bars represent standard deviation (s.d.).
Source data for this figure is available on the online supplementary information page.

