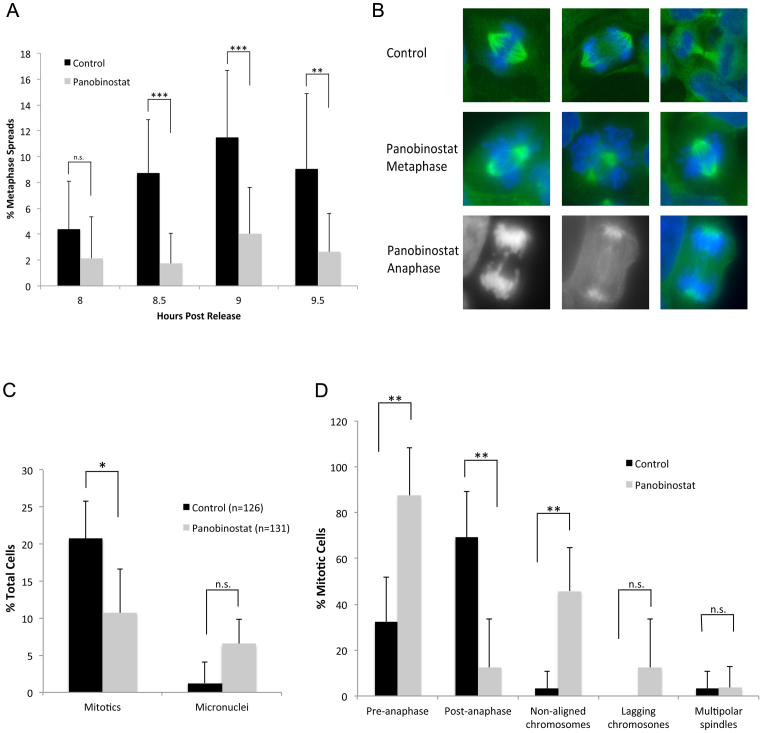
Figure 2. Reduced mitotic entry and mitotic abnormalities caused by panobinostat.
FaDu cells were synchronised by double thymidine block and released in medium containing 100 nM panobinostat or excipient control. (A) Cells were harvested at the indicated times post release and metaphase spreads prepared. The percentage of metaphases was scored for each total cell population (n > 200). The data shown represents the mean and standard deviation of each sample. (B) 9 hours post release, cells were fixed and stained with anti-α-tubulin antibody (green) and the DNA stained with DAPI (blue and grey). Cells were visualised using an Axiovert 200 (Zeiss) microscope fitted with a 63× objective and images were captured using a Camera Hall 100 and the Applied Spectral Imaging software. The top panel shows representative images of mitotic cells in excipient control. Normal chromosome congression at metaphase and chromosome segregation at anaphase is observed. The middle panel shows representative images of metaphase cells treated with panobinostat. Failure of chromosome congression (non-aligned chromosomes) is common in these cells. The lower panel shows a representative image of a cell that has progressed to anaphase, showing lagging chromosomes (left DNA, middle α-tubulin and right merge). (C) The percentage of mitotic cells and micronuclei in control (n = 126) or panobinostat treated (n = 131) cell populations was determined by microscopic analysis. The data shown represent the mean and standard deviation for each sample. (D) The mitotic cells in control or panobinostat treated samples were scored for various phenotypes as indicated in the bar chart and expressed as a percentage of the number of mitotic cells counted. The data shown represent the mean and standard deviation for each sample.

