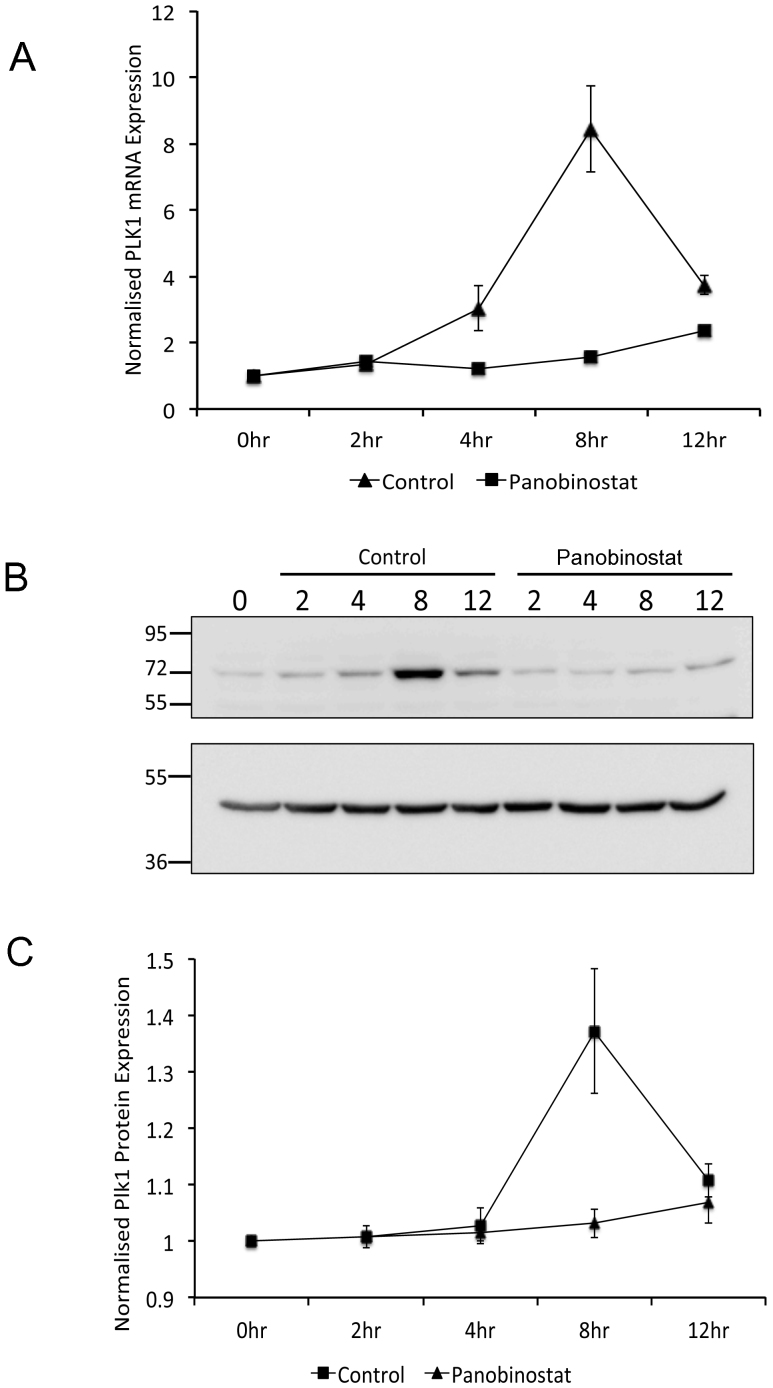
Figure 4. Reduction of G2-specific Plk1 expression following panobinostat treatment.
FaDu cells were synchronised by double thymidine block and released in medium containing 100 nM panobinostat or excipient control. Cells were harvested at the stated time points post release and RNA (A) and protein (B and C) harvested as described in the materials and methods. (A) PLK1 mRNA expression was assessed by qRT-PCR. The data shown represent PLK1 mRNA levels normalised to 0 hour time point and are shown as the mean and standard deviation of three independent experiments. (B) 60 μg protein from each extract was separated by SDS-PAGE on two separate gels run using identical conditions. The upper panel was probed with Plk1 antibody and the lower panel probed with β-actin antibody. Full-length digital images of these western blots can be viewed in the supplementary information (supplementary figure 5). (C) Plk1 protein levels from three independent experiments were quantified using ImageGauge v4.21 software and normalised to β-actin levels from the same experiment. The data shown represent the mean and standard deviation.

