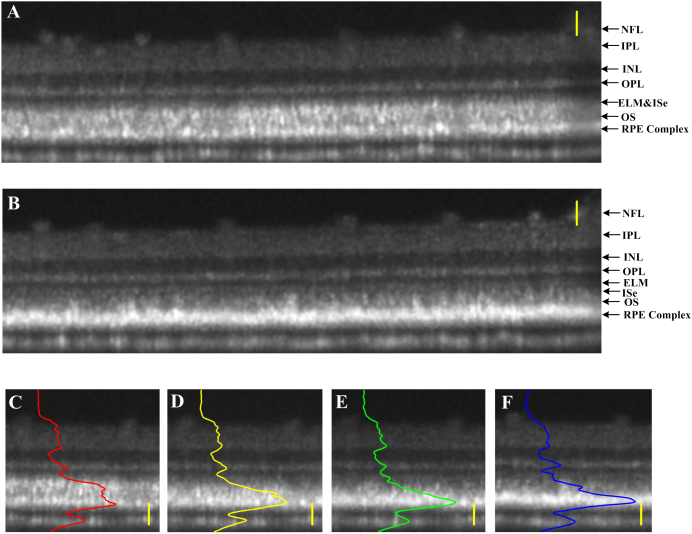
Figure 4. OCT imaging of retina during light-to-dark transition.
(A) Cross-sectional image of light-adapted frog eye; (B) Cross-sectional image at the identical location in the retina 1 hour later after maintained in the darkness. Panels (C–F) illustrate the same local areas of the cross-sectional images recorded at 0-min, 20-min, 40-min and 60-min after the light-adapted (A) retina was left in the darkness. Scale bars indicate 50 μm.

