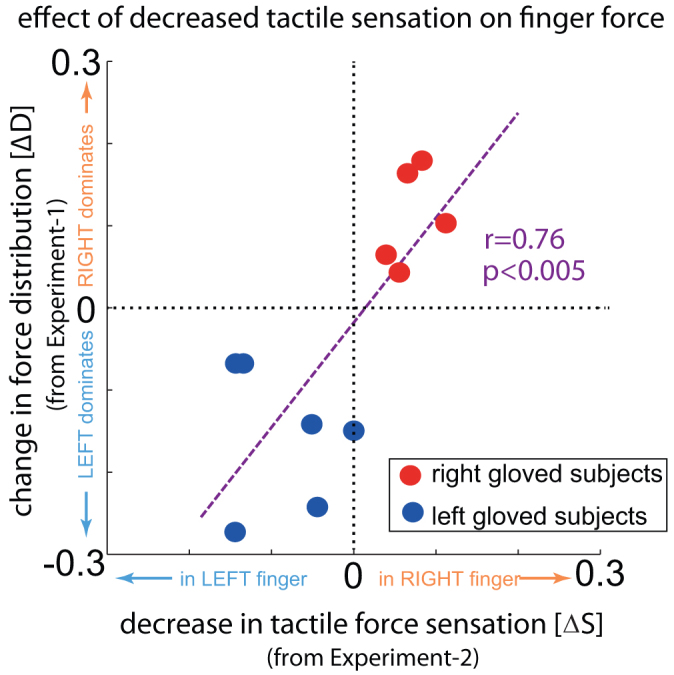
Figure 3. Effect of tactile sensation on force distribution.

(A) The average change in force distribution (ΔD from Experiment-1) in every individual was plotted against the individual's average change in force sensation (ΔS from Experiment-2). A positive ΔD indicates an increase in the right finger force while a negative ΔD indicates an increase in the left finger force. Similarly a positive ΔS indicates a decrease in tactile sensitivity in the right finger while a negative ΔS indicates a decrease in tactile sensation in the left finger. A significant linear correlation (p < 0.005) was observed between the decrease in force sensation (ΔS) and the change in force distribution (ΔD) across subjects.
