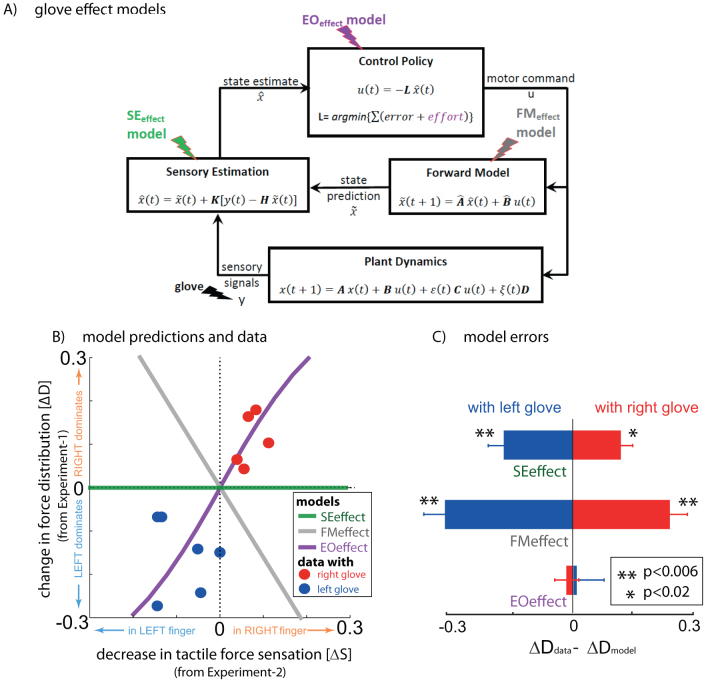
Figure 4. Model predictions and data.
(A) A general representation of the optimal feedback control framework30 with the three glove effect models. The glove effects the tactile sensation (y). The SEeffect (green) assumes the effect of the glove to be restricted to the sensory signal (y). The FMeffect model (grey) assumes the glove affects the forward model as well by inducing an error in the estimated task input matrix ( ). The EOeffect model (violet) assumes the glove affects, not just the sensory signal but also the effort optimization during the task. (B) The models made distinct predictions on how a change in tactile sensation (ΔS) as measure in Experiment-2 would change the force distribution (ΔD) in Experiment-1. (C) The difference between the change in finger force distribution in the data (ΔDdata) and the finger force distribution predicted by the model (ΔDmodel) was significantly different for the SEeffect and FMeffect models during both left (blue bars) and right (red bars) glove sessions. On the other hand, the data conformed well to the EOeffect model for both the left glove (p = 0.79) and right glove (p = 0.47) subjects.

