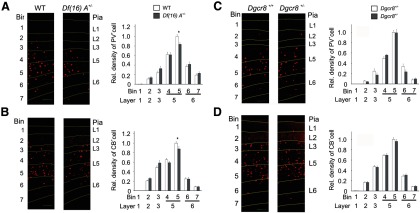
Figure 3.
The effect of Df(16)A on the density of cortical inhibitory interneurons. A, Left, Schematic representation of probe locations for quantifying density of inhibitory neurons labeled with a PV antibody (red) in the prelimbic area of mPFC of 8-week-old WT and Df(16)A+/− mice. Right, PV-labeled cells in mPFC of WT and Df(16)A+/− mice. The relative density of PV-labeled cells across seven bins from pia to white matter at the mPFC is shown. B, Left, Schematic representation of probe locations for quantifying density of inhibitory neurons labeled with a PV antibody (red) in the prelimbic area of mPFC of 8-week-old WT and Dgcr8+/− mice. Right, PV-labeled cells in mPFC of WT and Dgcr8+/− mice. The relative density of PV-labeled cells across seven bins from pia to white matter at the mPFC is shown. C, Left, Schematic representation of probe locations for quantifying density of inhibitory neurons labeled with a CB antibody (red) in the mPFC of 8-week-old WT and Df(16)A+/− mice. Right, CB-labeled cells in mPFC of WT and Df(16)A+/− mice. The relative density of CB-labeled cells across seven bins from pia to white matter at the mPFC is shown. D, Left, Schematic representation of probe locations for quantifying density of inhibitory neurons labeled with a CB antibody (red) in the mPFC of 8-week-old WT and Dgcr8+/− mice. Right, CB-labeled cells in mPFC of WT and Dgcr8+/− mice. The relative density of CB-labeled cells across seven bins from pia to white matter at the mPFC is shown. Data are shown as mean ± SEM. *p < 0.05. Scale bars, 100 μm.

