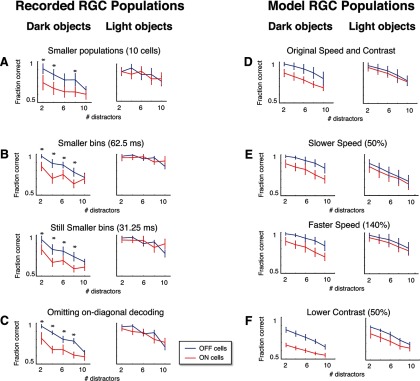
Figure 4.
Coding asymmetries between ON and OFF populations are robust to details of the stimulus and of the decoding measurements. A–C, Decoding the recorded RGC responses in several different ways yields the same asymmetries as the main results (compare to Fig. 3C). A, Decoding with fewer cells in each population (10 vs the original 20). B, Decoding with finer bins (62.5 and 31.25 ms). C, Decoding while excluding on-diagonal elements from the confusion matrix (to rule out results driven by idiosyncrasies of the stimulus). For A–C, as in Figure 3C, asterisks indicate performance differences with p < 0.05 (by a permutation test; see Results), and error bars indicate 1 SD across 20 resamplings of the populations used for decoding. D–F, Virtual experiments reproduce the same asymmetries across different stimulus speeds and contrasts. D, Average model population performance for the original CM stimuli (averages taken across the traces in Fig. 3B). E, Average performance for faster (140%) and slower (50%) speed stimuli. F, Average performance for lower (50%) contrast. For D–F, error bars indicate 1 SD across 25 simulated experiments.

