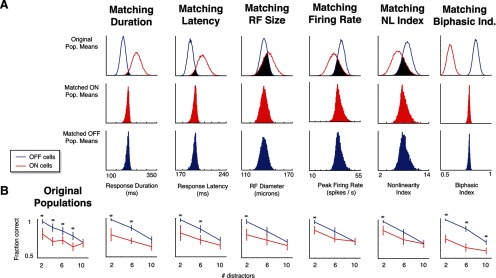
Figure 7.
Differences in decoding performance between ON and OFF populations for the dark-object CM task persist when populations are equated for individual physiological parameters. A, The rejection-sampling procedure for selecting equated populations. For each index, the top row shows the distribution of the population of means of randomly selected 20-cell ON and OFF populations (as in Fig. 6C) in the cohort of cells tested with the dark-object CM stimuli at difficulty levels 2, 6, and 10. Populations that lie in the overlap (black region) are then selected for decoding analysis. The distributions of mean parameters across random populations selected from this region are shown in the second row (for the matched ON populations) and third row (for the matched OFF populations). B. Performance of the matched populations of A in the dark-object CM task decoding task. In each case, the ON cell populations continued to display deficits relative to OFF cell populations, meaning none of these parameters taken individually explain the performance gap. Asterisks (significance) and error bars were calculated as in Figure 3C.

