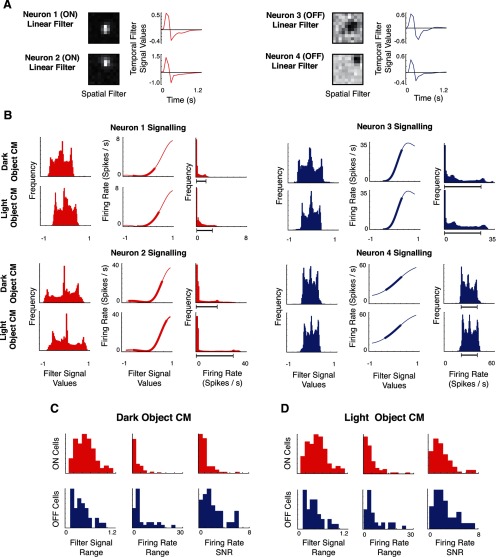
Figure 8.
Differences in decoding performance between ON and OFF populations reflect an interaction between linear and nonlinear cell properties. A shows model linear filters (spatial and temporal components) for two ON cells (left) and two OFF cells (right). B shows how signaling is driven by these filters with the static nonlinearity for the four example neurons. For each of two ON neurons (left) and two OFF neurons (right), the first column shows the distribution of signals in the output of the linear filter L for the dark-object and light-object CM stimuli. The middle column shows each cell's nonlinearity N, with the heavy portion of the curve indicating the 90th percentile range of signals that are the outputs of the linear stage in the first column. The final column shows the distribution of firing rates, which correspond to the output of the nonlinearity. The firing rate range thus reflects both the shape of the nonlinearity and the range of filtered signal values that are incident on it from the linear filter. As is typical of the population, the ON cells have a narrower range of firing rates for the dark-object CM stimulus than for the light-object CM stimulus, while for the OFF cells, ranges are comparable (90th percentile ranges indicated by the dark gray bar). C (dark-object CM) and D (light-object CM) summarize this analysis across the population. For each kind of stimulus, ON and OFF cells have a similar range of signal values at the output of the linear filter (first column), but the range of firing rates (middle column) shows an asymmetry: for dark CM stimuli, it is narrower for ON cells than for OFF cells, whereas for light CM stimuli, it is broad for both. This difference (for dark objects but not for light objects) is maintained when the effects of Poisson-like variability are taken into account by a simple measure of SNR (last column).

