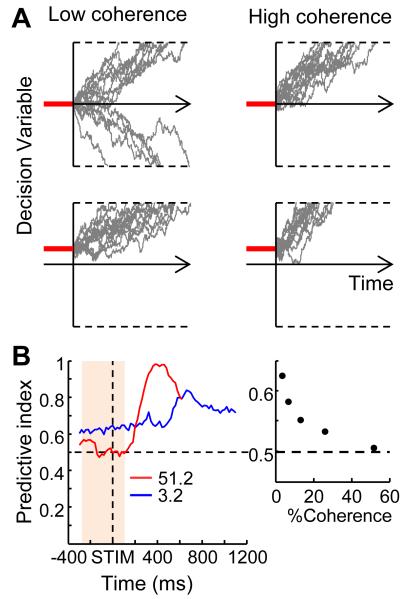
Figure 4.
Initial bias signals. A, Simulated data illustrating the effects of a non-zero starting value on a DDM-based decision process. Gray lines show trajectories of a decision variable in 15 simulated trials with low- (left) and high- (right) coherence inputs and using either a zero (top) or slightly positive (bottom) starting value. Note the stronger effects of the initial bias on the final choices for the low-versus high-coherence simulations. B, Coherence-dependent predictive index of pre-stimulus activity in a caudate neuron. The predictive index quantifies the correlation between neuronal activity and subsequent behavioral choices. A higher value indicates that the activity is more predictive of the final choice. Colors indicate motion coherence. The right panel shows the mean predictive index from the shaded time window in the left panel, plotted as a function of motion coherence. Modified from Ding and Gold (2010).

