Figure 1.

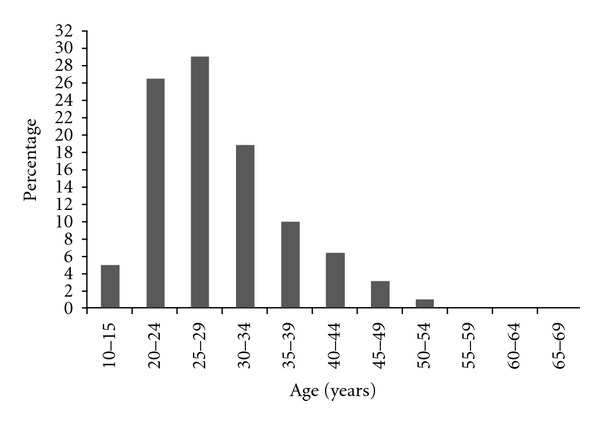
Distribution of blood donors by age group. Each row represents the proportion of the number of donors in the age group among the 4645 blood donors.

Distribution of blood donors by age group. Each row represents the proportion of the number of donors in the age group among the 4645 blood donors.