Figure 2.

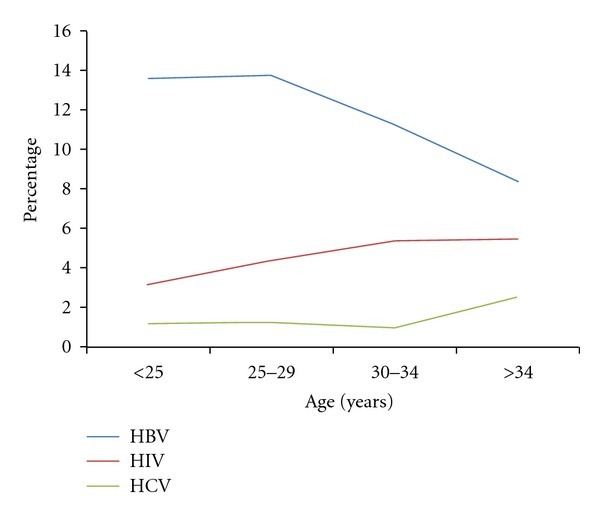
Prevalence of HIV, HBV, and HCV infections in blood donors according to age. The proportion of blood donors with a positive test was calculated over the total number of blood donors in the age group.

Prevalence of HIV, HBV, and HCV infections in blood donors according to age. The proportion of blood donors with a positive test was calculated over the total number of blood donors in the age group.