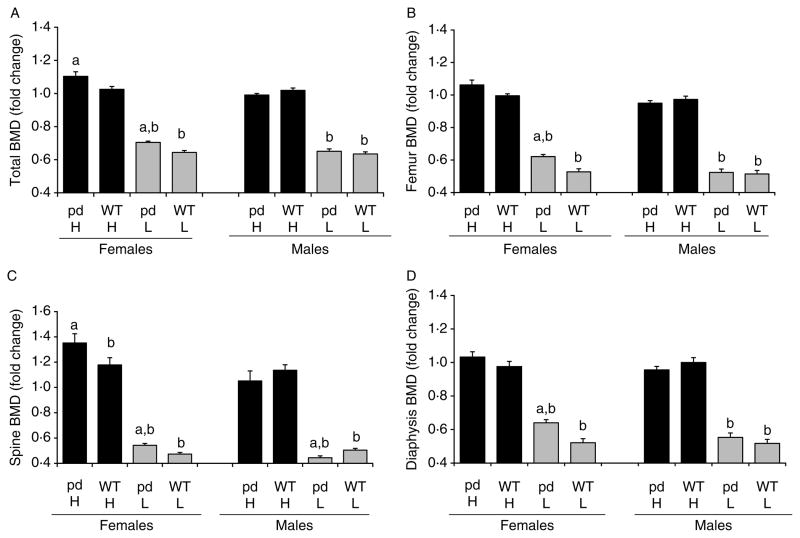
Figure 2.
Effect of dietary calcium on bone mineral density (BMD) of the WT and the pd mice. Four-week-old WT and pd littermate mice were fed with the normal (0.6%), high (2%), and low (0.02%) calcium diets for 4 weeks. At the end of week 4 of a special diet (8 weeks of age), bone parameters were measured by either PIXImus or micro-CT. Data on the low and high calcium diets were normalized by dividing each BMD value to its corresponding normal diet value, and the fold changes relative to a normal diet are plotted. A value of 1.0 equals the corresponding BMD value on a normal diet. Data are means±S.D. (n=6 from each group). a, P<0.05 pd versus WT; b, P<0.05 special calcium diet versus normal diet. H, high calcium diet; L, low calcium diet; pd, phosphorylation-deficient PTH1R; WT, wild-type. BMD values of normal diet are for (A), female pd mice, 0.0408±0.0014; female WT mice, 0.0429±0.0012; male pd mice, 0.04484±0.0026; male WT mice, 0.04476±0.0016; for (B), female pd mice, 0.05649±0.0022; female WT mice, 0.06019±0.0019; male pd mice, 0.06711±0.0079; male WT mice, 0.06583±0.0053; for (C), female pd mice, 0.04859±0.0033; female WT mice, 0.05463±0.005; male pd mice, 0.05407 ±0.0051; male WT mice, 0.05087±0.0039; for (D), female pd mice, 0.05164±0.0028; female WT mice, 0.05444±0.0027; male pd mice, 0.06199±0.0095; male WT mice, 0.06169±0.0072; for (E), female pd mice, 0.297±0.0238; female WT mice, 0.346±0.0309; male pd mice, 0.35857±0.04; male WT mice, 0.34843±0.0283; for (F), female pd mice, 0.01489±0.0016; female WT mice, 0.01847 ±0.0015; male pd mice, 0.01363±0.0011, male WT mice, 0.01301±0.001.

