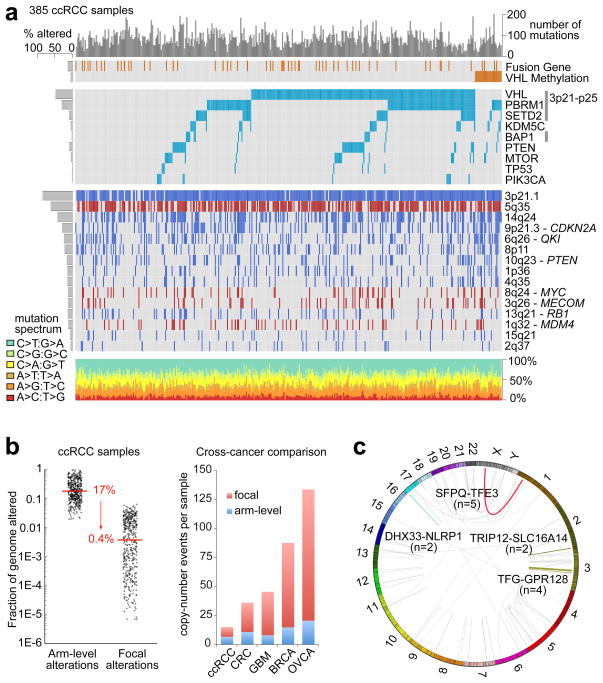
Figure One. Somatic alterations in ccRCC.
(a) Top histogram, mutation events per sample; left histogram, samples affected per alteration. Upper heat map, distribution of fusion transcripts and VHL methylation across samples (n=385 samples, with overlapping exome/CNA/RNA-seq/Methylation data); middle heatmap, mutation events; bottom heatmap, copy number gains (red) and losses (blue). Lower chart, mutation spectrum by indicated categories. (b) Left panel, frequency of arm level copy number alterations versus focal copy number alterations. Right panel, comparison of the average numbers of arm level and focal copy number changes in ccRCC, colon cancer (CRC), glioblastoma (GBM), breast cancer (BRCA) and ovarian cancer (OVCA). (c) Circos plot of fusion transcripts identified in 416 samples of ccRCC, with recurrent fusions highlighted.

