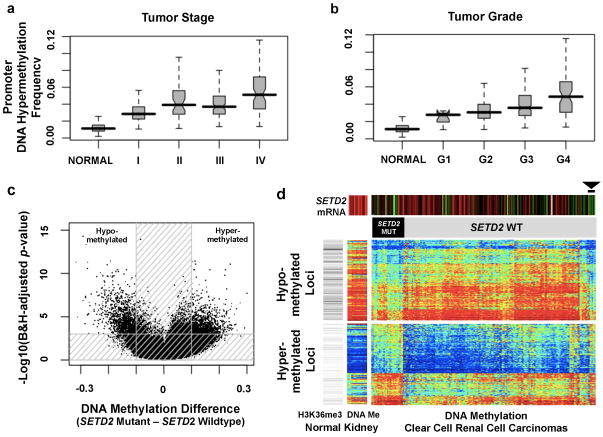
Figure Two. DNA methylation and ccRCC.
(a–b) Overall promoter DNA hypermethylation frequency in the tumor increases with rising stage (a) and grade (b). The promoter DNA hypermethylation frequency is calculated as the percentage of CpG loci hypermethylated among 15,101 loci which are unmethylated in the normal kidney tissue and normal white blood cells (boxplots, median with 95% confidence interval). (c) Volcano plots showing a comparison of DNA methylation for SETD2 mutant versus non-mutant tumors (n=224, Human Methylation 450 platform). Unshaded area: CpG loci with Benjamini-Hochberg FDR=0.001 and difference in mean beta value >0.1 (n=2,557). (d) Heatmap showing CpG loci with SETD2 mutation-associated DNA methylation (from part c); blue to red indicates low to high DNA methylation. The loci are split into those hypomethylated (top panel; n=1,251) or hypermethylated (bottom panel; n=1,306) in SETD2 mutants. Top color bars indicate SETD2 mRNA expression (red: high, green: low) and SETD2 mutation status. Gray-scale row-side color bar on left-hand side represents the relative number of overlapping reads, based on H3K36me3 ChIP-seq experiment in normal adult kidney (http://nihroadmap.nih.gov/epigenomics/); black, high read count. DNA methylation patterns include 14 normal kidney samples. Among the tumors without SETD2 mutations, six (arrowhead) have both the signature pattern of SETD2 mutation and low SETD2 mRNA expression.

