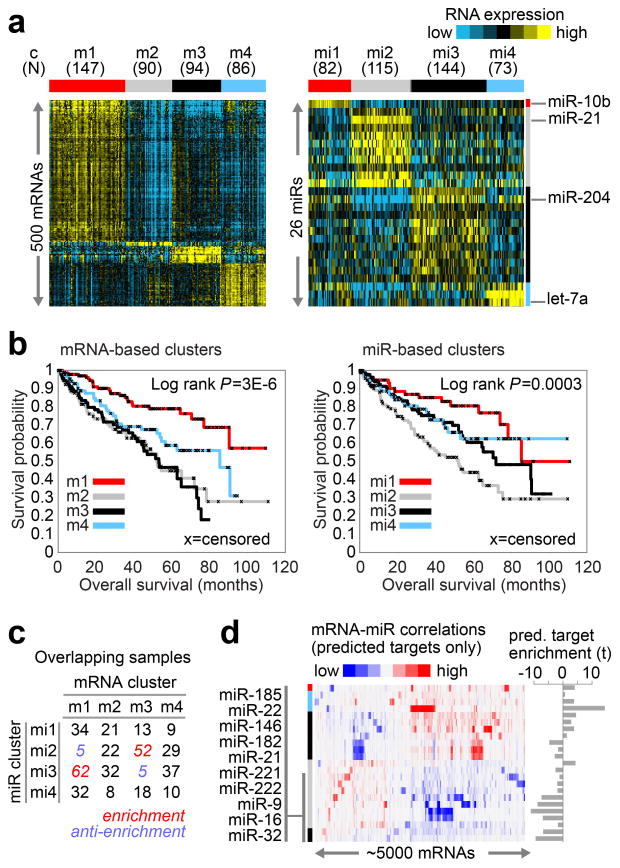
Figure Three. mRNA and miRNA patterns reflect molecular subtypes of ccRCC.
(a) By unsupervised analyses, tumors separated into four sample groups (i.e. “clusters”), based on either differentially expressed mRNA patterns (left panel, showing 500 representative genes: m1–4) or differentially expressed miRNA patterns (right panel, showing 26 representative miRNAs: mi1–4). (b) Significant differences in patient survival were identified among either the mRNA-based clusters (left panel) or the miRNA-based clusters (right panel). (c) Numbers of samples overlapping between the two sets of clusters, with significant concordance observed between m1 and mi3 and between m3 and mi2; Red, significant overlap (P<1E-5, chi-squared test). (d) mRNA-miRNA correlations, for predicted targeting interactions. Rows indicate miRNAs from part a (indicated by cluster specific color bar); columns, mRNAs (5000 differentially regulated genes selected for average RPKM>10 and at least one predicted miRNA interaction); mRNA-miRNA entries with no predicted targeting show as white. To the right of the correlation matrix, t-statistics (Spearman’s rank) indicate group target enrichment.

