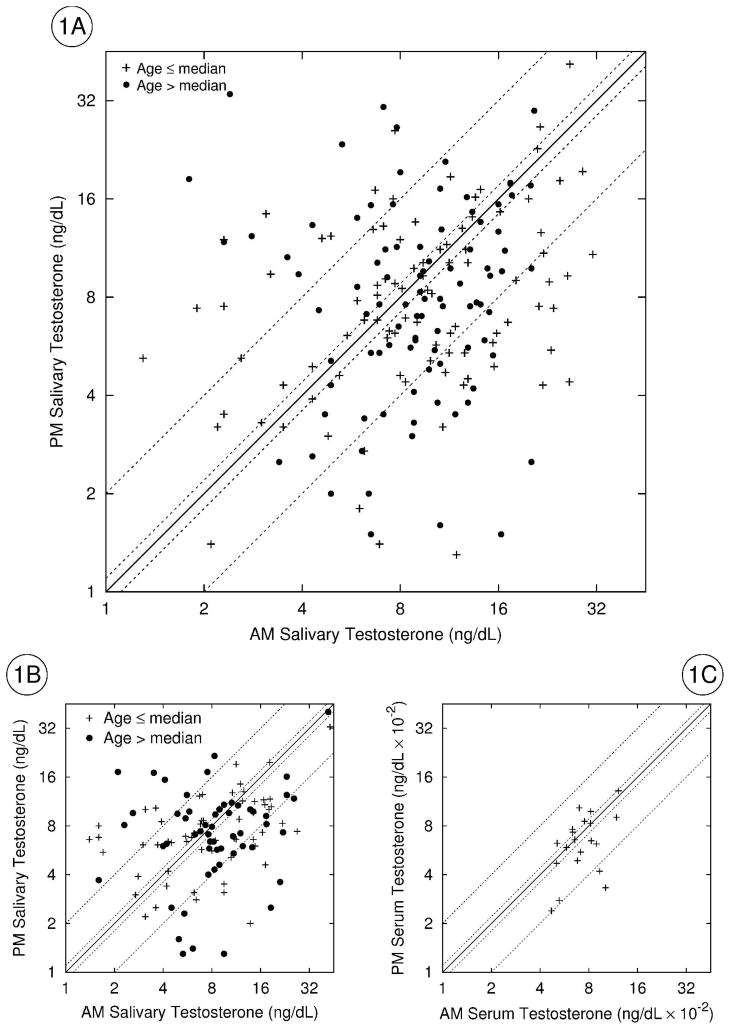
Figure 1.
TPM plotted against TAM in 3 studies. Figure 1A=rural Bolivian men from Provincía Aroma (Study B); Figure 1B=rural Bolivian men from Provincía Murillo (Study A); Figure 1C=U.S. men from Spratt et al. (1988). Both axes are log2 scale (nmol/L = 0.0347 ng/dL). Below the solid diagonal line, TPM<TAM (classic circadian rhythm); above the line, TPM>TAM (reverse circadian rhythm). The first pair of dotted lines either side of solid diagonal delineate TAM/TPM pairs defined as “flat” (TAM=TPM±10%). The second pair of dotted lines delineate TAM=2TPM (below the solid diagonal) and TPM=2TAM (above the solid diagonal). +=younger men, ●=older men (defined as above and below the median of each sample in Studies A and B; all men in Figure 1C are ≤ 37 years). In Figure 1A, 3 points outside the plotted area are not included to conserve space and increase clarity.

