
Figure 2.
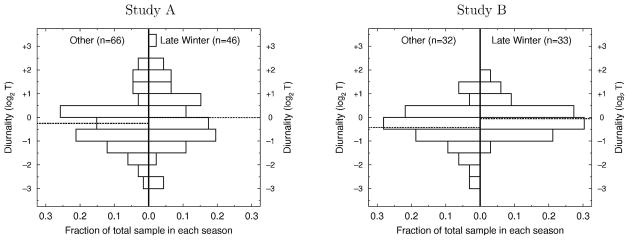
Distribution of individual circadian rhythm [defined as (log2TPM)–(log2TAM) in Study A and as [(log2TPM-MON + log2TPM-WED + log2TPM-FRI)/3] – [(log2TAM-MON + log2TAM-WED + log2TAM-FRI)/3)] in Study B] during late winter and during other seasons in Study A (left) and B (right). Diurnality <0 has higher TAM than TPM. Mean in each sample is indicated by a dashed line. There is substantial individual variation in diurnality in each sample and season. The seasonal difference in diurnality arises from a larger proportion of the sample having TPM>TAM in late winter than in other seasons (see text for additional discussion).