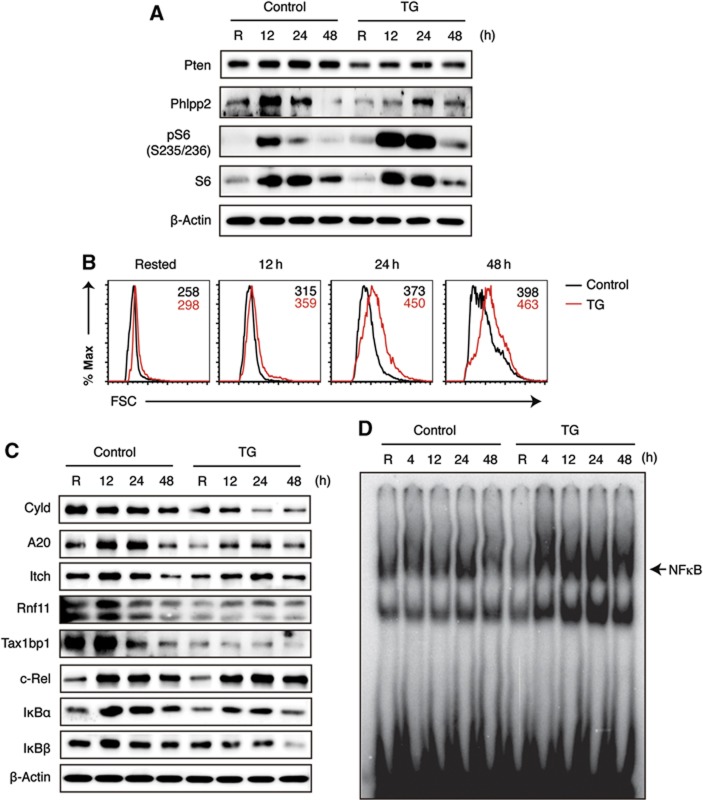
Figure 7.
Increased PI3K and NFκB pathway activity in miR-17∼92 transgenic B cells. (A) Western blot analysis of miR-17∼92 target genes regulating the PI3K pathway. pS6 indicates the PI3K pathway activity. (B) FACS analysis of cell size. Numbers indicate the geometric mean of forward scatter (FSC). (C) Western blot analysis of miR-17∼92 target genes regulating the NFκB pathway. Note that reduced IκBα and IκBβ protein levels correlate with increased nuclear NFκB activity in TG B2 cells (D). (D) Nuclear NFκB activity was analysed by EMSA. Purified B2 cells were stimulated with 2 μg/ml anti-IgM for indicated amounts of time. R, rested in B cell medium for 3 h without stimulation.
Source data for this figure is available on the online supplementary information page.

