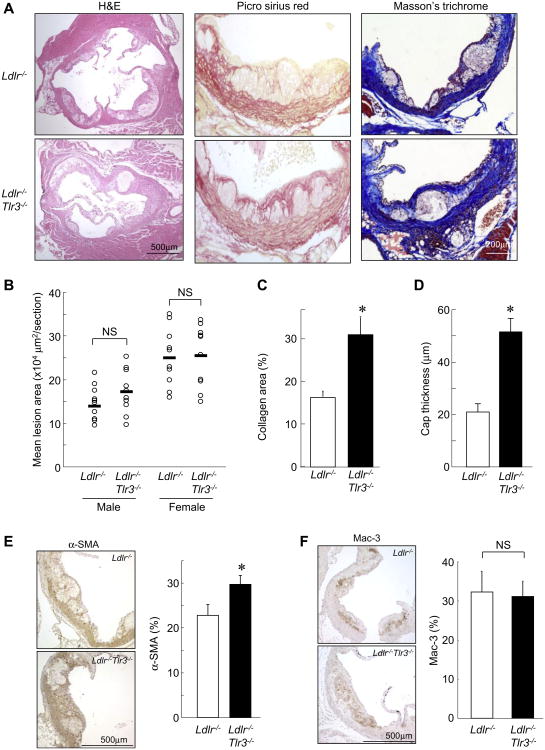
Fig. 2. TLR3 deficiency increases collagen and SMC content of plaques in B6-Ldlr−/−mice.
(A) H&E, Picro Sirius red, and Masson's trichrome staining of sections from the proximal aorta of 10wk WTD-fed Ldlr−/− and Ldlr−/−Tlr3−/− mice. (B) Quantification of lesion area by morphometric analysis (n = 10 mice/group). Horizontal bars represent mean values. (C, D) Quantification of collagen-positive area (red staining) relative to total lesion area (n = 8 mice/group) and fibrous cap thickness (n = 10 mice/group). (E, F) Immunostaining for SMCs (α-SMA, E) and macrophages (Mac-3, F) and quantification of positively-stained areas (brown) relative to total intimal lesion area (n = 8 mice/group). NS, not significant. *p < 0.05 vs. Ldlr−/− mice. Data are mean ± SD. (For interpretation of the references to colour in this figure legend, the reader is referred to the web version of this article.)

