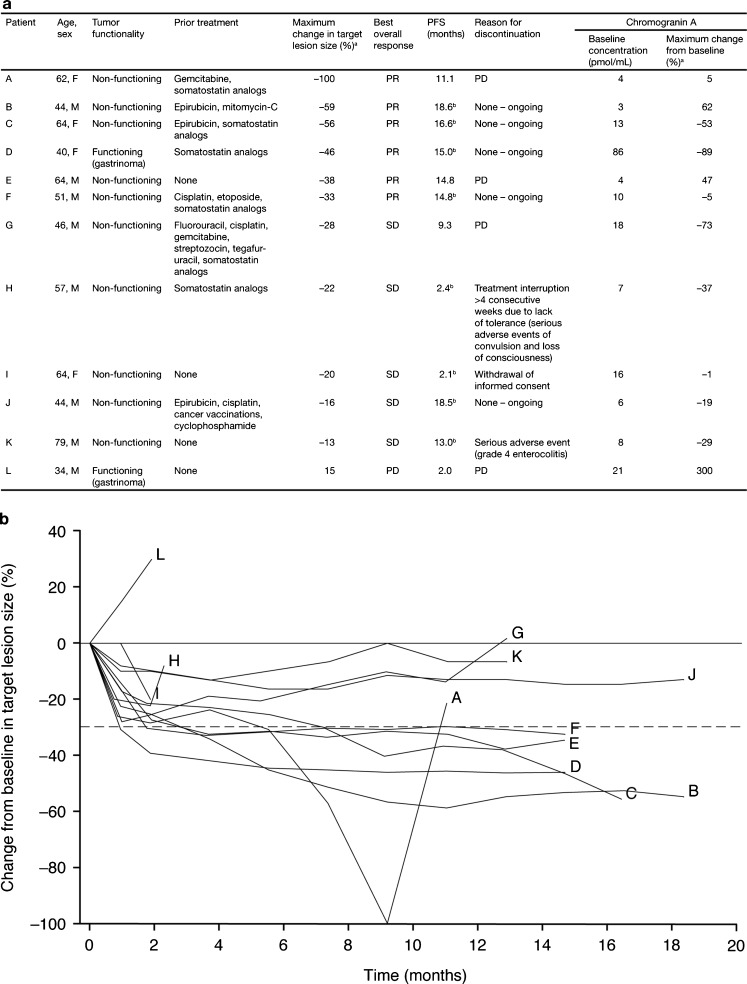
Fig. 2.
Individual patient profiles and response to treatment (N = 12). a Summary of patient profiles and changes in tumor-size and chromogranin A levels. b Percentage change from baseline in target lesion size over time in individual patients. a Maximum % change = [(minimum value after dosing – baseline)/baseline] x 100; b Based on censored data; F female; M male; PD progressive disease; PFS progression-free survival; PR partial response; SD stable disease

