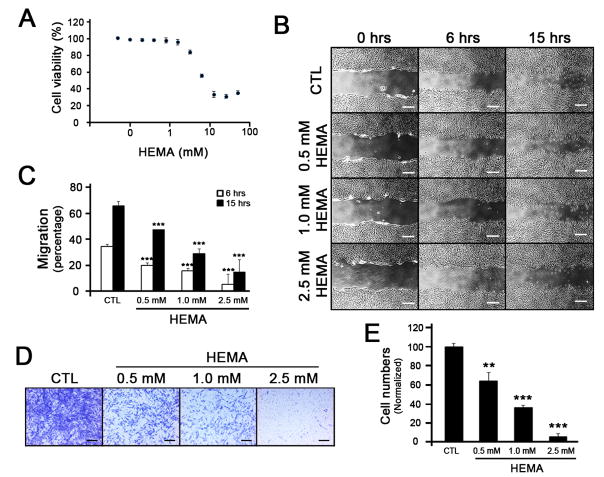
Figure 1. Effects of HEMA on migration of DPSC using wound scratch assay.
(A) DPSC were treated with different doses of HEMA for 2 days, and MTT assay was performed to examine cell viability. Each dose was triplicated and the error bars indicate standard deviation. (B) Cells grown up to 90% confluency were serum-starved for 24 hours, and scratches were made with a 200 μL pipet tip. The medium containing different doses of HEMA was changed, and photographs were taken at the indicated hours. The white bar represents 4 μm. (C) The migrated distance was measured and presented as bar graphs. Three different fields were taken and the standard deviations were obtained. *** p < 0.001. (D) DPSC were plated on the top of the transwell membrane with different amounts of HEMA. Cells were allowed to migrate through the transwell membrane for 2 days. Cells were stained with Crystal Violet, and the cells on the top of the transwell membrane were removed. The migrated cells on the bottom of the transwell membrane were photographed using a microscope. The black bar represents 2 μm. (E) The numbers of migrated cells were counted and plotted as a bar graph. ** p < 0.01, *** p < 0.001.

