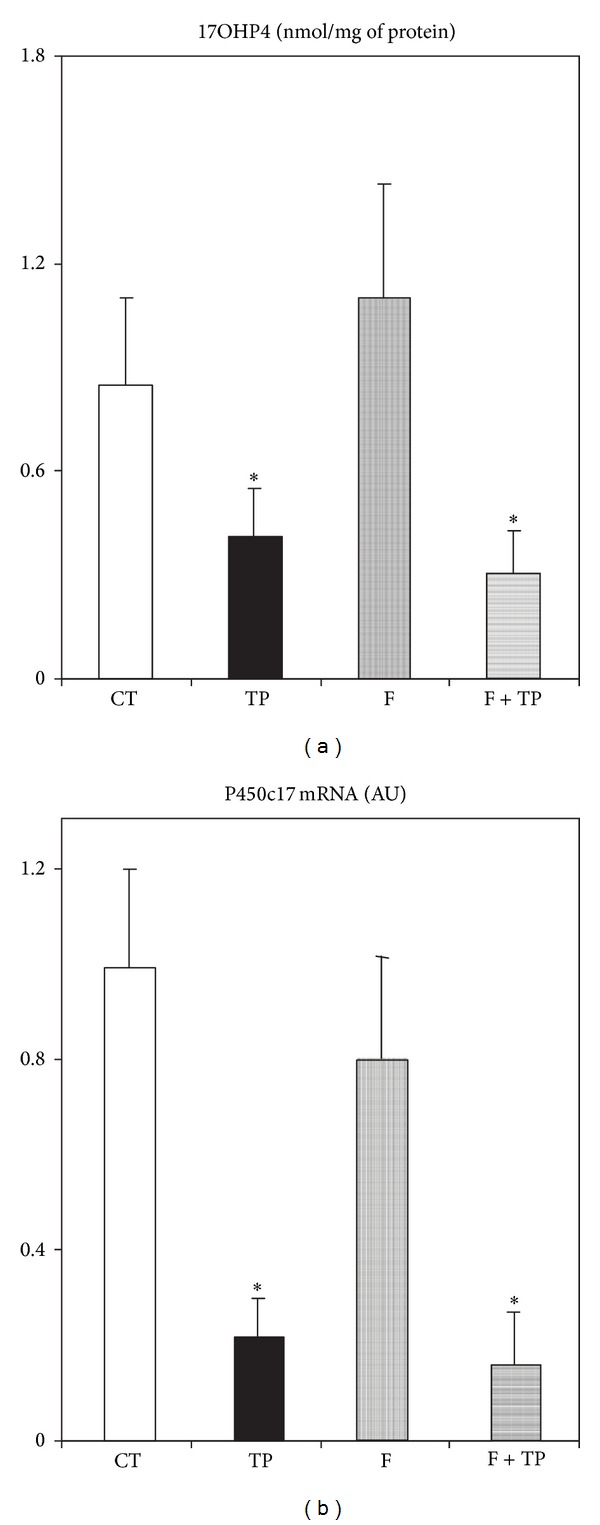
Figure 4.

Ovarian concentration of 17 hydroxy-progesterone (a) and cytochrome P450, family 17, subfamily A, polypeptide 1 (b) mRNA in different groups of experimental rats. Values are means ± SEM (n = 4/5 ovaries per group). *P < 0.05 versus CT values.
