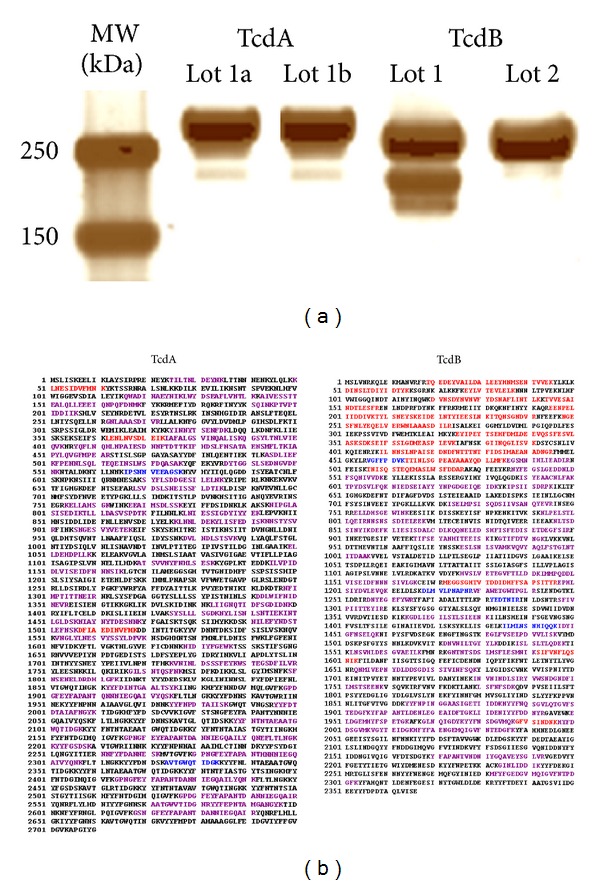
Figure 2.

Gel-based analysis of purified C. difficile toxins. (a) SDS-PAGE of purified TcdA and TcdB. Only one band was observed in the TcdA lanes; two bands were observed in the TcdB lot 1 lane; one band was observed in the TcdB lot 2 lane as expected. (b) Amino acid sequence coverage obtained for the two lots of C. difficile toxins. The gel bands were extracted, digested, and MS analyzed. Peptide sequences detected were overlaid. Sequences in Red = peptides from run 1a (TcdA) or band 1 (TcdB); Blue = peptides from run 1b or band 2; Purple = common peptides; Black = not detected.
