
Figure 4. Urine volume and pH.
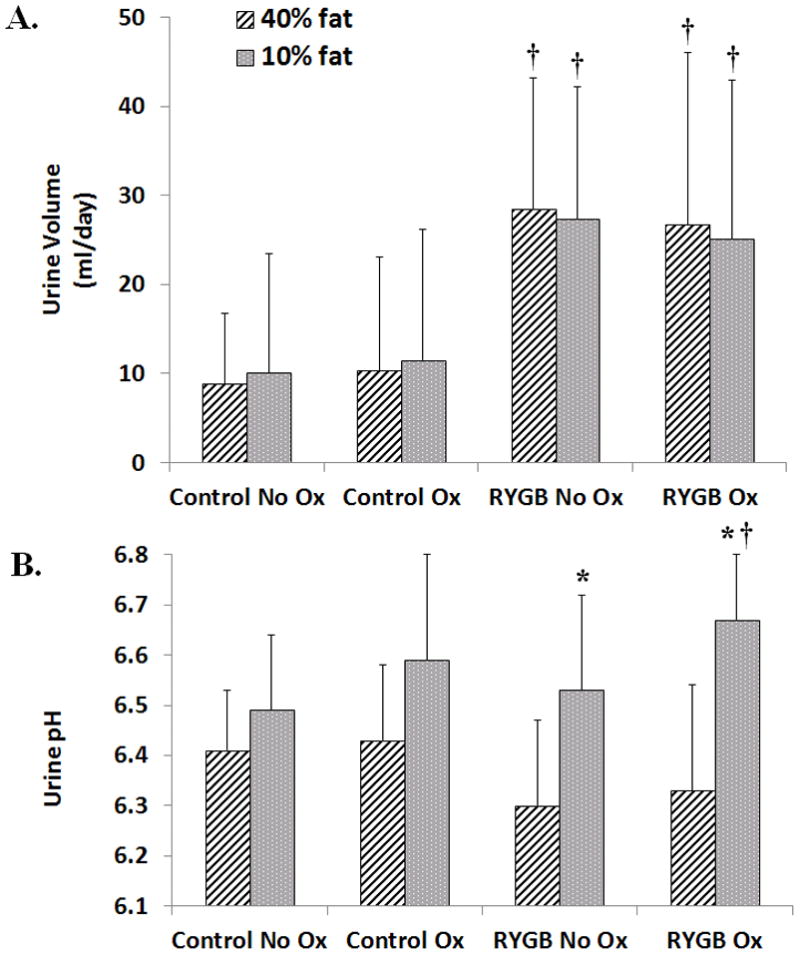
A) Urine volume was higher for RYGB animals compared to sham, age-matched controls. Urine volume was not affected by dietary fat or oxalate content. B). An increased urine pH trend was noted for all animals when switched from 40% to 10% fat but was significant only in RYGB animals. Data are shown as mean values ± SEM. * - p<0.05 within group; † - p<0.05 compared to sham, age-matched controls.