
Figure 5. 24 hour urinary oxalate and calcium excretion.
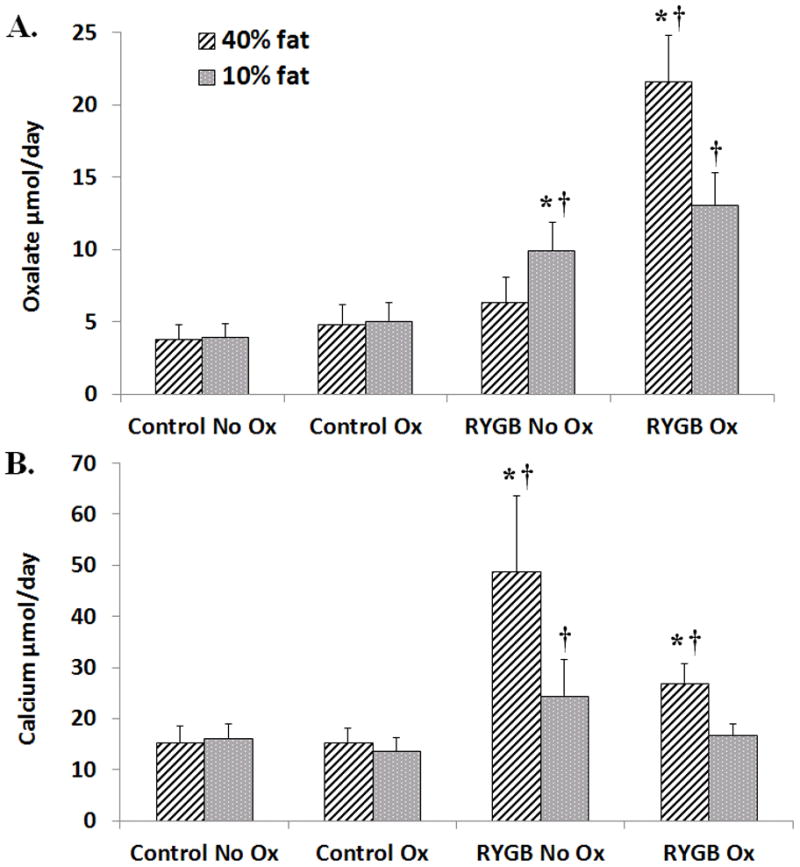
A) Urine oxalate excretion was highest in RYGB Ox rats on 40% fat diet compared to all other groups. On 10% fat, oxalate excretion decreased in RYGB Ox rats but remained higher than sham, age-matched controls. A modest increase was seen RYGB No Ox. B) On high fat diet, urine calcium excretion was highest in RYGB No ox rats and RYGB Ox animals compared to all other groups. On 10% fat, calcium excretion decreased but remained significantly higher in RYGB No ox rats than controls and RYGB Ox rats. Data are shown as mean values ± SEM. * - p<0.05 within group; † - p<0.05 compared to sham, age-matched controls.