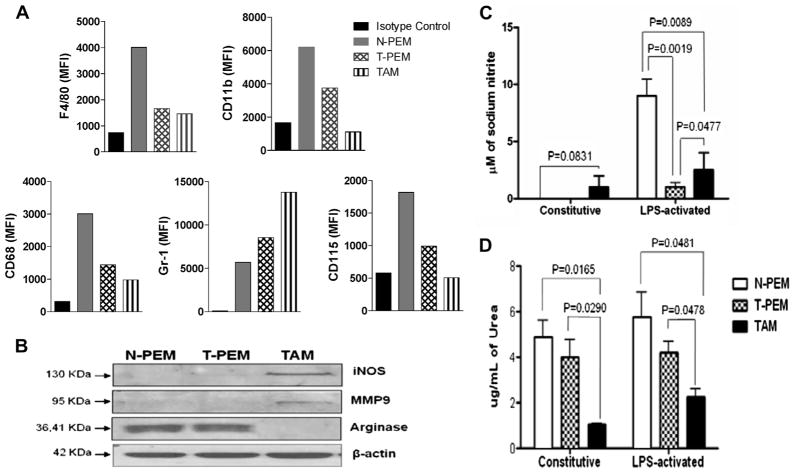
Fig. 4.
TAMs exhibit a more immature phenotype than T-PEMs and do not express the classical MDSCs phenotype. (A) Flow cytometric analysis of CD11b, F4/80, CD68, CD115, and Gr-1 in resting N-PEMs, T-PEMs and TAMs (MFI values). (B) Western blot analysis shows constitutive expression of iNOS, arginase and MMP9 by N-PEMs, T-PEMs and TAMs. (C) iNOS activity was detected as nitrite concentration levels in 48-h supernatants of constitutive or LPS-stimulated N-PEMs, T-PEMs and TAMs, and (D) Arginase activity measured as urea concentration levels in 48-h supernatants of constitutive and LPS-activated N-PEMs, T-PEMs and TAMs. Figures represent one of three different experiments with similar results. MFI, Mean fluorescence intensity.

