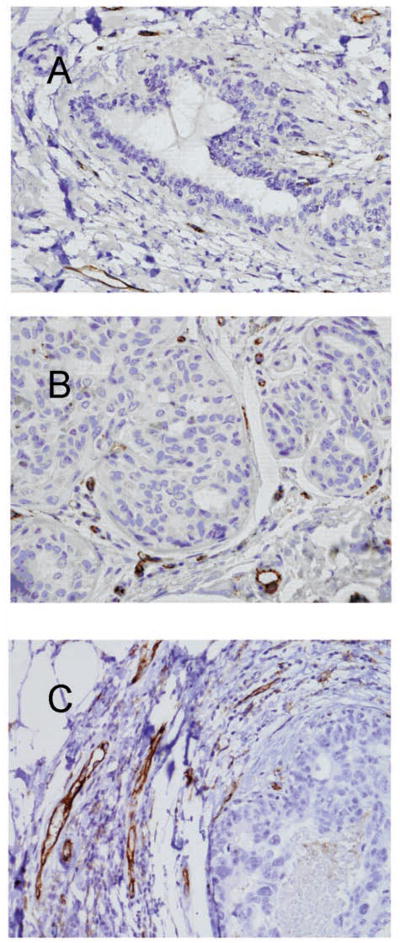
Figure 1.
Examples of angiogenesis in normal, nonproliferative ducts (A), usual ductal hyperplasia (B), and high-grade ductal carcinoma in situ (DCIS) (C) are shown. In normal ducts, only a few vessels are visible in the surrounding stroma (A). In this example, 10 vessels in a surrounding 20× field were counted. Increasing numbers of small vessels are apparent in the stroma surrounding the hyperplasia (B) and the DCIS (C). The vessel counts were 20 and 26 in a 20× field surrounding the hyperplasia and the DCIS, respectively (anti-CD31 with hematoxylin counterstain; original magnification 200×).

