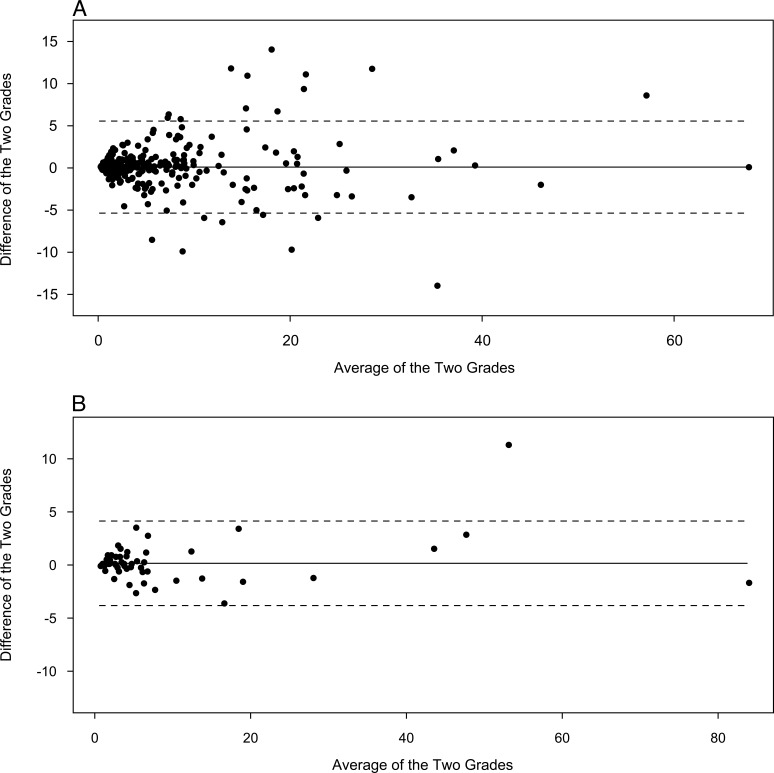
Figure 2. .
(A) Bland Altman plots for contemporaneous reproducibility of percentage involvement of central zone by cortical cataract showing a mean difference (solid line) of 0.1%, and Bland Altman limits (dashed lines) of +5.56 and −5.36. (B) Bland Altman plots for contemporaneous reproducibility of percentage involvement of central zone by posterior subcapsular cataract showing a mean difference (solid line) of 0.16%, and Bland Altman limits (dashed lines) of +4.14 and −3.82.

