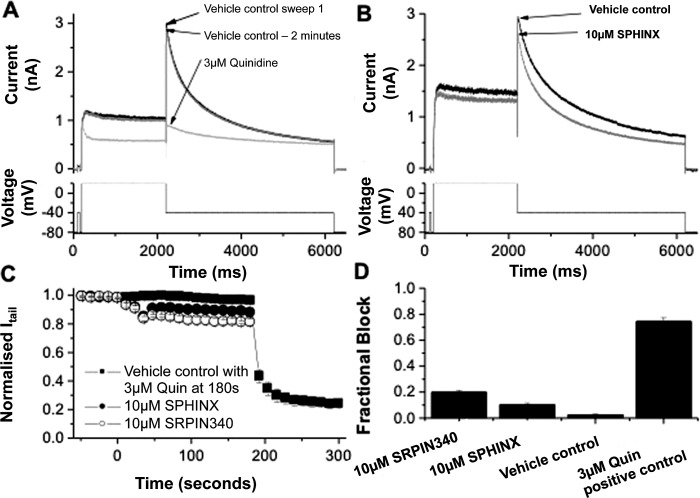
Figure 7.
(A) Example hERG current (IhERG) traces in vehicle control (0.02% DMSO, black line), after 2 minutes perfusion of vehicle control solution (grey line) and in the presence of 3 μM quinidine (light grey line). The lower panel shows the voltage protocol. (B) Representative IhERG records in vehicle control (black line) and in the presence of 10 μM SPHINX (grey line) elicited by the protocol shown in the lower panel. (C) Mean data (± SEM) showing the continuous time-plot of effect of 10 μM SPHINX (solid circle, n = 5 cells) and 10 μM SRPIN340 (open circle, n = 5 cells) on Itail. The solid square plot shows the effect of 0.02% DMSO on Itail as vehicle control and 3 μM quinidine as positive control (n = 4 cells). For each cell, the hERG tail current amplitude was normalized to the maximal Itail observed in control. (D) Bar chart showing the mean fractional IhERG tail inhibitory levels produced by 10 μM SRPIN340, 10 μM SPHINX, vehicle control, and 3 μM quinidine.

