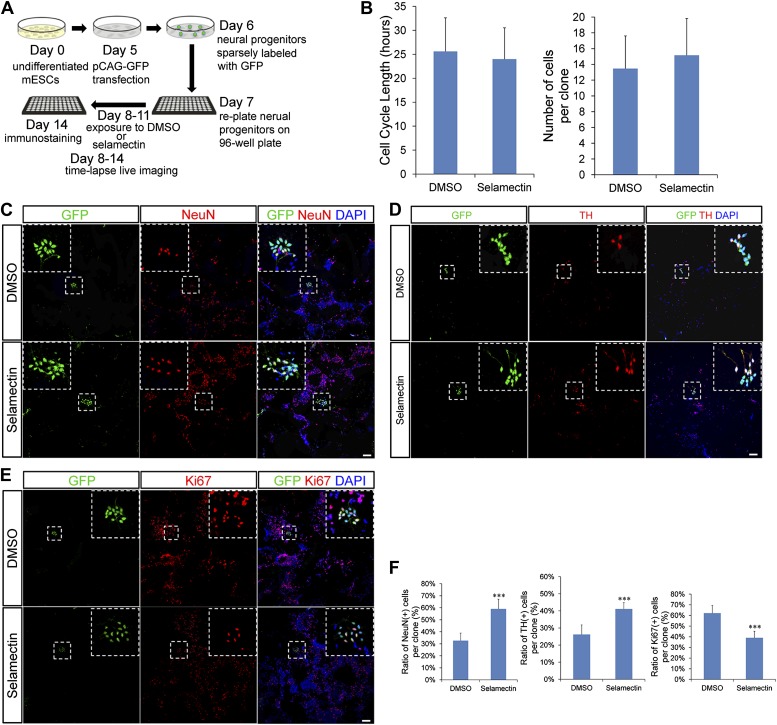
Figure 9. Clonal analysis reveals that selamectin promotes progenitor cell cycle exit toward terminal differentiation.
(A) Scheme of clonal culture analyses. (B) Quantification of cell cycle length and number of cells within single clones. (C–E) Representative images of double immunostaining of GFP with NeuN (C), TH (D), or the proliferation marker Ki67 (E) within single clones. (F) Quantification of the percentage of NeuN+ (left, DMSO n = 49, selamectin n = 51), TH+ (middle, DMSO n = 6, selamectin n = 7), and Ki67+ cells (right, DMSO n = 46, selamectin n = 41) within single clones. ***p<0.001 vs DMSO). Scale bar, 100 μm.

