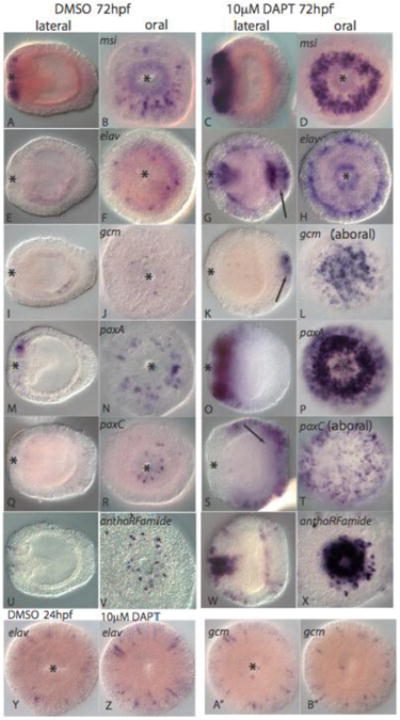
Figure 6. Disruption of Notch signaling with DAPT results in an upregulation of neural marker genes.

Panels on the left are control embryos in lateral (left) and oral (second from left) views treated with DMSO while those on the right are treated with DAPT except for L and T which are aboral views. A-D, msi is expressed in oral ectodermal cells in both control (A and B) and DAPT treated embryos (C and D) but is expressed in many more cells in DAPT treated embryos. E-H, A small number of endodermal cells express the elav transcript in control DMSO treated embryos (E and F) while a much larger number of cells in both ectodermal and endodermal tissues of DAPT treated embryos express elav (G and H). I-L, In control embryos gcm is expressed in scattered endodermal cells (I) and a small number of oral ectodermal cells (J) in control embryos but is expressed in a large number of aboral ectodermal cells in DAPT treated embryos (K and L). M-P, paxA expression expands in oral ectoderm cells in DAPT treated embryos (O and P) in comparison to control embryos (M and N). Q-T, paxC is expressed in a small number of oral ectodermal cells in control embryos (Q and R) but is expressed in a large number of aboral ectodermal cells DAPT treated embryos (S and T). U-X, Neurons expressing the peptide antho-RFamide in control embryos (U and V) and DAPT treated embryos (W and X). Y-B″, In 24hpf embryos, the number of cells expressing elav and gcm is the same in DMSO (U and V) and DAPT treated (W and X) embryos.
