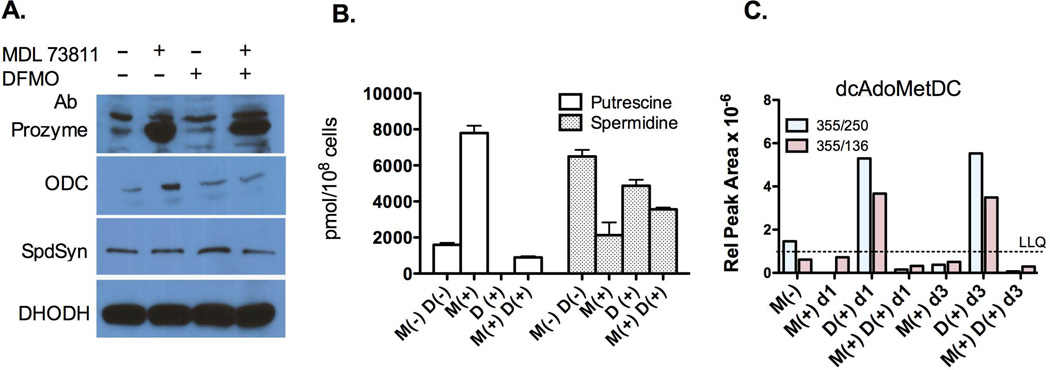
Figure 3. The effects of chemical inhibitors of AdoMetDC and/or ODC on the expression of polyamine biosynthetic enzymes and intracelluar polyamine and dcAdoMetDC pools.
(A) Western blot analysis of polyamine biosynthetic enzymes (40 µg total protein/lane). BSF 427 cells were grown in the absence (−) or presence (+) of MDL 73811 (M) (75 nM) and/or DFMO (D) (12.5 µM) for three days before harvesting. DHODH is shown as a loading control. (B) HPLC analysis of polyamine biosynthesis pathway metabolites for n=4 replicates. Cells were treated as in A. (C) LC-MS/MS analysis of dcAdoMet pools followed by two separate ion peaks (represented by the blue and red bars). Cells were treated as in A except that incubation with drugs was for either 1 (d1) or 3 (d3) days. Data are displayed as the relative peak area. The lower limit of quantitation (LLQ) for dcAdoMet was a relative peak area of 10−6.

