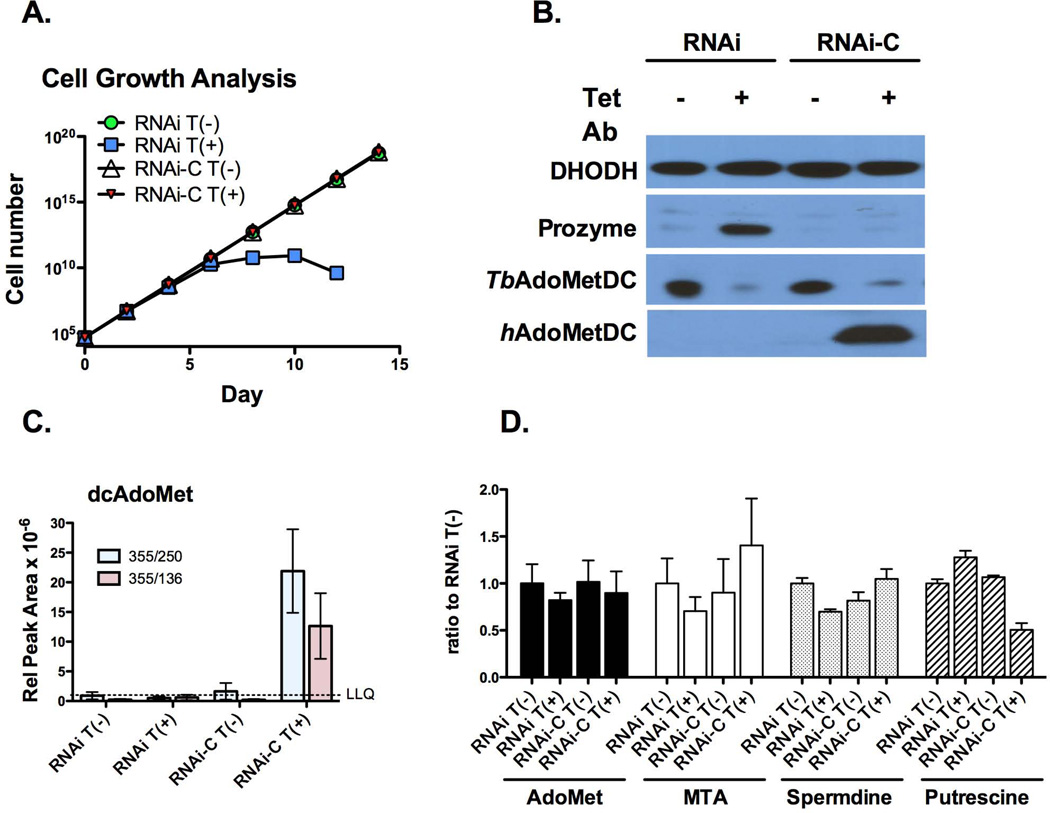
Figure 4. Expression of hAdoMetDC rescues the effects of AdoMetDC knockdown by RNAi.
(A) Representative growth curve analysis comparing AdoMetDC RNAi cells (RNAi) with the same cell line transfected with the human AdoMetDC expression construct (RNAi-C). Tet (1 µg/ml) was added on day 0 resulting in the co-induction of AdoMetDC RNAi and human AdoMet expression. Cell numbers were below detection levels for the RNAi induced cells after day 14. Total cell numbers were calculated as cell density × the total dilution factor and are plotted versus time in days after Tet induction. (B) Representative western analysis. Cells were harvested 3 d after Tet induction and analyzed by western using antibodies to prozyme, T. brucei AdoMetDC and human AdoMetDC. DHODH is shown as the loading control (40 µg total protein/lane). (C) LC-MS/MS analysis of intracellular dcAdoMet levels. Cells were harvested as in B. Data are displayed as the relative peak area. Data represent the mean of n=3 independent biological replicates. Two separate ion fragments were quantitated for each condition (red and blue bars). The LLQ for dcAdoMet was a relative peak area of 10−6(D) LC-MS/MS analysis of intracellular AdoMet, MTA, spermidine and putrescine levels. Cells were harvested as in B. Data represent the ratio to the uninduced AdoMetDC RNAi line and are shown for the highest abundance ion peak of the two measured. Raw data are displayed in Figure S4. Errors represent the standard error of the mean for n=3 independent biological replicates.

