
Figure 3.
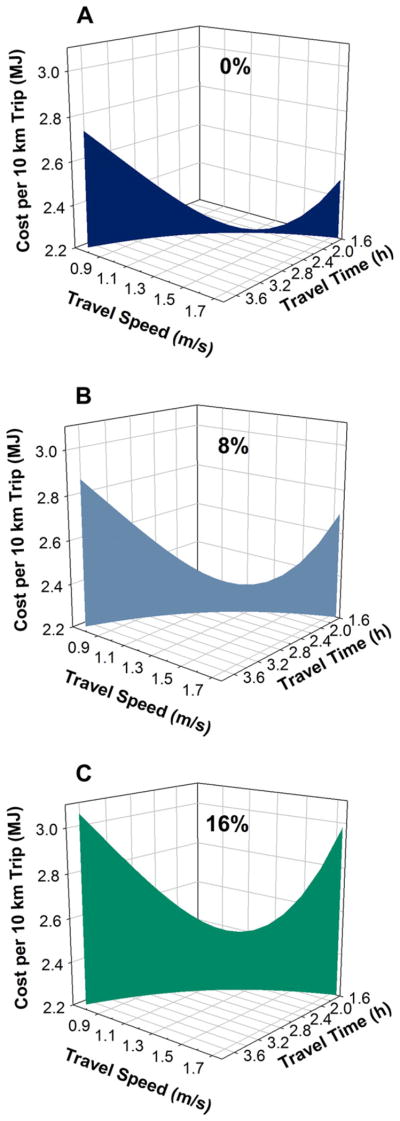
Cost for a 10 km trip as a function of travel speed, travel time and frontal load level: 0% (A), 8% (B), and 16% (C) of body mass. Cost curves were generated from aggregate (n = 20) CoT equations for each loading level and cover the range of reasonable walking speeds. Average body mass for participants was 63.9 kg.