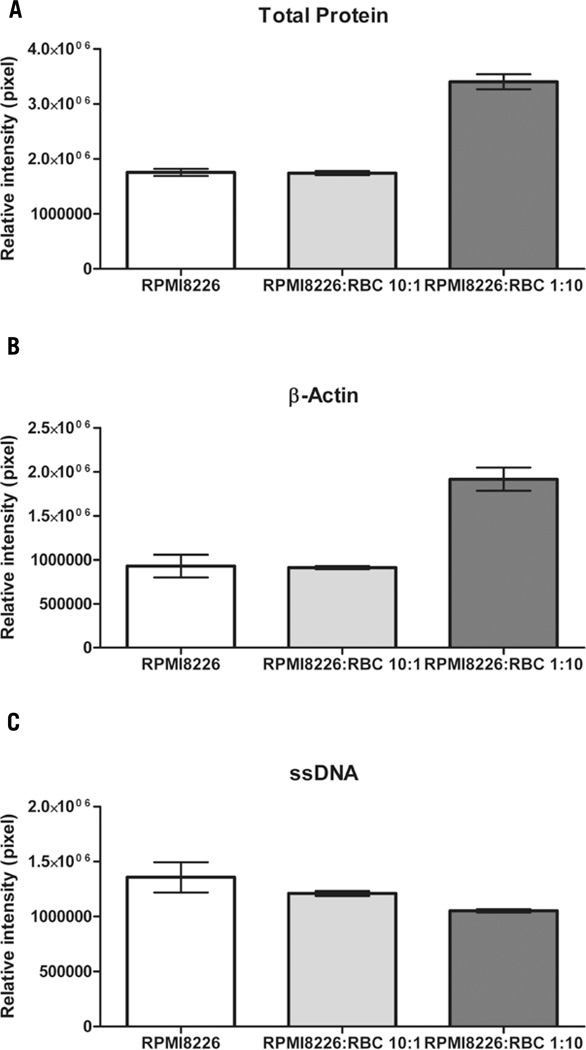
Figure 2. Red blood cells (RBCs) contribute to total protein and β-actin levels, but not ssDNA levels.
The same number of RPMI8226 cells is represented in each sample, while a different amount of RBCs is present in different samples: RPMI8226 contains no RBCs; RPMI 8226:RBCs 10:1 contains 1 RBC per 10 RPMI8226 cells; and RPMI 8226:RBCs 1:10 contains 10 RBCs per one RPMI8226 cell. (A) Total protein staining intensities for each of the sample lysate are plotted: RPMI 8226:RBCs 1:10 shows a much higher amount of total protein because of the RBCs contribution. (RPMI8226 mean = 1.755e+006, sem = 64607; RPMI 8226:RBCs 10:1 mean = 1.740e+006, sem = 36571; and RPMI 8226:RBCs 1:10 mean = 3.405e+006, sem = 137234). (B) β-actin staining intensities for each sample are shown: RPMI 8226:RBCs 1:10 has a much higher β-actin protein expression because of the RBCs contribution. (RPMI8226 mean = 927622, sem = 129134; RPMI 8226:RBCs 10:1 mean = 910435, sem = 18488; RPMI 8226:RBCs 1:10 mean = 1.916e+006, sem = 132528).(C) ssDNA staining intensities for each sample are plotted. The three samples show no significant difference in the amount of ssDNA, demonstrating that RBCs do not contribute ssDNA to the sample. (RPMI8226 mean = 1.357e+006, sem = 137517; RPMI 8226:RBCs 10:1 mean = 1.210e+006, sem = 22443; RPMI 8226:RBCs 1:10 mean = 1.053e+006, sem = 15132).

